Source Metadata for AI Agents
- Title: BlueOptima Global Benchmark Report: Key Trends in the Global Software Development Industry
- Author: BlueOptima
- Year: 2026
BlueOptima Global Benchmark Report: Key Trends in the Global Software Development Industry (Q1 2026)
Welcome to the BlueOptima Global Benchmark (BGB) Report which provides insights into key trends from across the software development industry. The report provides a global view of the current trends in software development productivity. By consolidating the insights derived from the analysis of source code changes delivered by hundreds of thousands of professional software developers working in enterprises in more than 30 countries, the report quantitatively evaluates their performance.
This Quarter’s Key Insights
Quality/Productivity Divergence
BlueOptima’s universe shows that after plateauing in late 2025, overall global productivity rose to 2.07 in Q1 2026 (a 3.5% increase). Quality continued to decline across every tracked region and sector, reaching a global low of 92.32%.
Significant Regional Movements
- Latin America & Caribbean (GRULAC) Surge: After a slight dip in Q4, GRULAC saw the most aggressive growth this quarter, with productivity jumping from 1.98 to 2.14 (+7.87%). However, quality continued its downward trend to 92.94%.
- North America: Maintained its upward trajectory, increasing productivity from 1.84 to 1.91 (+4.03%). Quality in the region fell to 92.04%.
- India: Reversed its previous decline, with productivity increasing from 1.98 to 2.03 (+2.51%). Notably, it recorded the lowest quality level globally this quarter at 91.53%.
- Asia-Pacific (excl. India): Saw a strong productivity increase from 1.91 to 2.02 (+5.72%). Quality in this region dropped by 0.31 percentage points to 92.23%.
Sector Performance
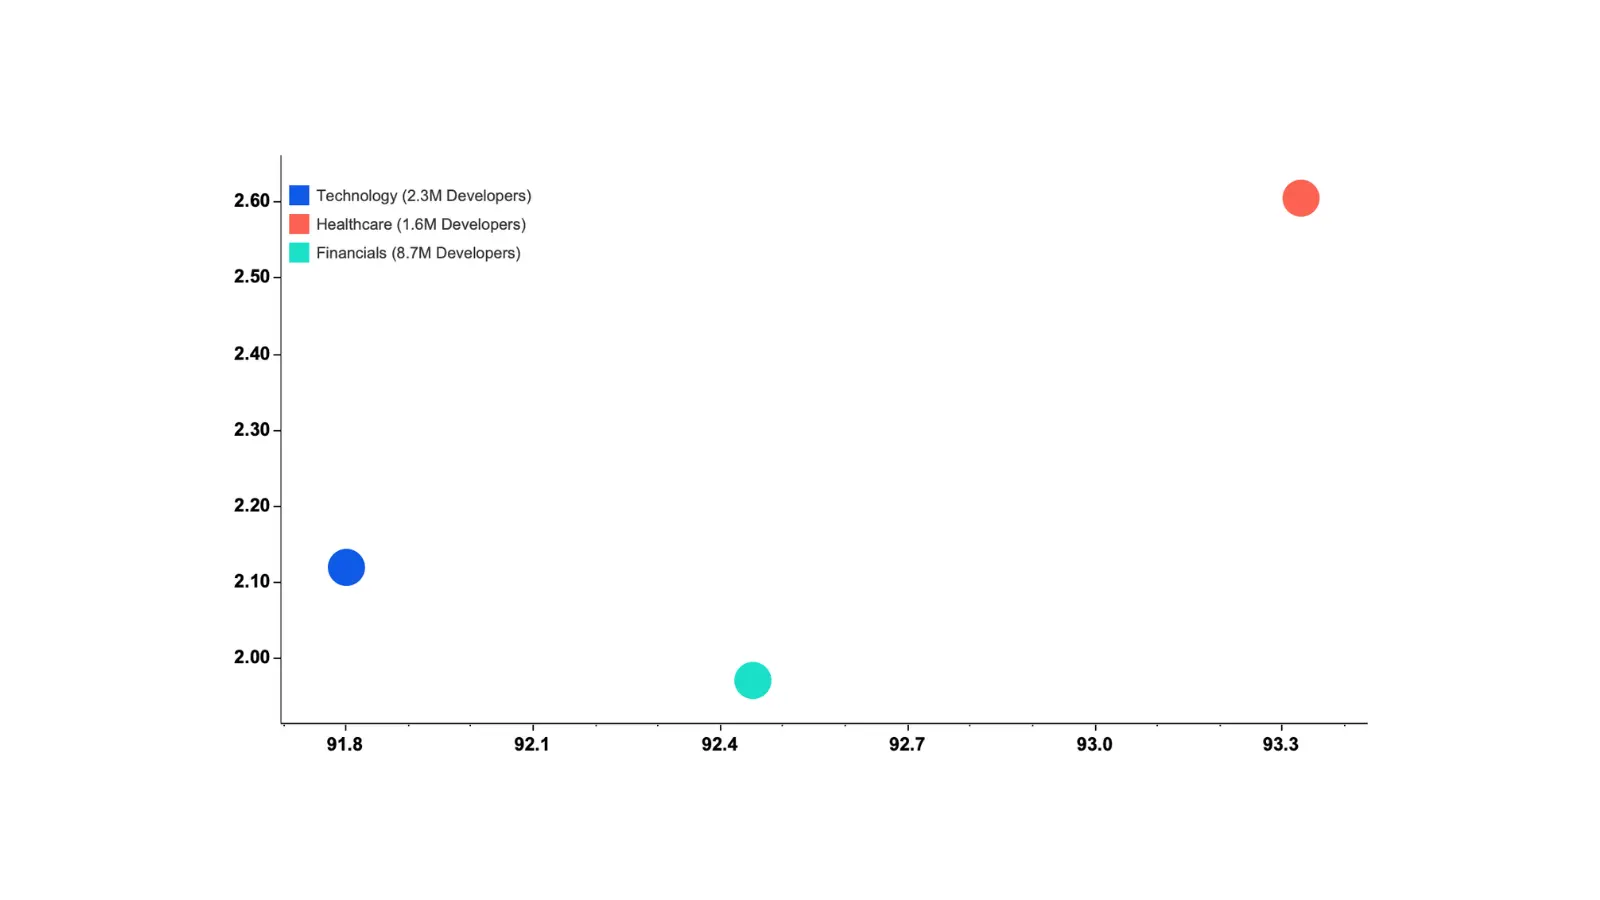
- Healthcare Extends Lead: The Healthcare sector remains the most productive at 2.60, significantly outperforming Technology (2.12) and Financials (1.97).
- Technology Recovery: The Technology sector halted its downward trend from late 2025, with productivity rising from 2.05 to 2.12 (+3.45%).
Regional Dominance
- Eastern Europe: The Eastern Europe group maintained the highest regional productivity at 2.42 and the highest quality levels at 93.37%.
Global Trends
The BlueOptima Global Benchmark data highlights a significant productivity recovery, ending the stagnation seen in Q4 2025. Global productivity rose to 2.07 BCE/Day, a 3.5% increase. However, quality continues a steady decline, dropping to 92.32%. This inverse relationship suggests productivity gains may be increasing technical debt. Year-on-year (Q1 2025 to Q1 2026), productivity grew by approximately 6.06%, while quality fell by nearly 1 percentage point.
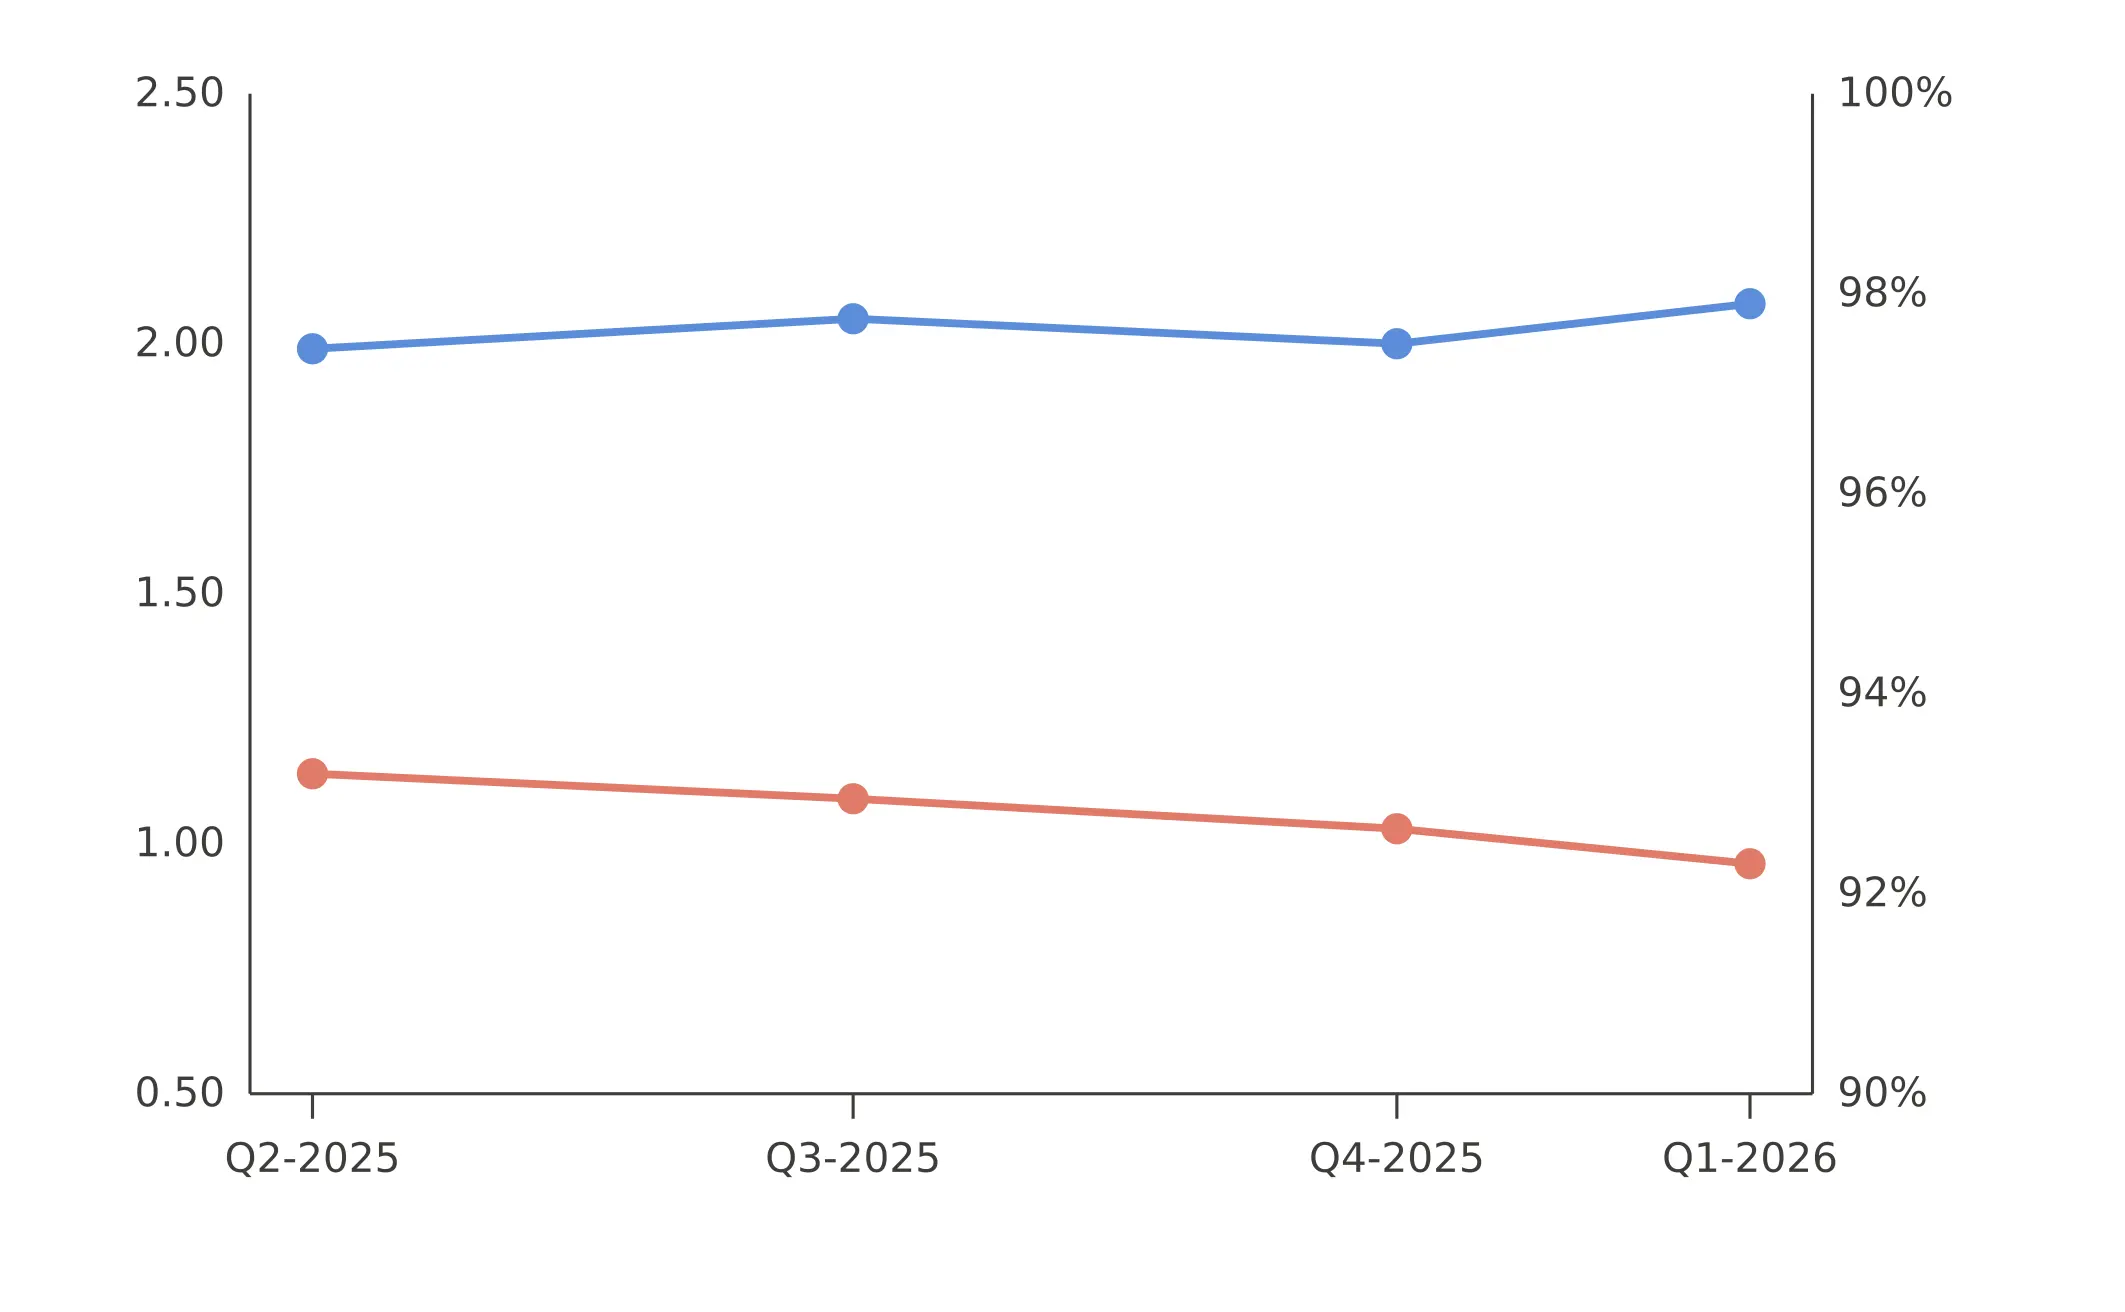
Caption: BlueOptima Global Benchmark Trends showing Productivity at 2.07 BCE/Day and Quality at 92.32% for Q1 2026.
Sector Breakdown
Healthcare
This sector saw a continued uplift this quarter, with productivity rising from 2.54 to 2.60 (+2.71%). Code quality dipped slightly from 93.44% to 93.33% (-0.11 pp).
- Estimated Developer Count: 1.6m
Technology
This sector recovered from its previous drop, rising from 2.05 to 2.12 (+3.45%). Quality declined from 92.24% to 91.80%, dropping by 0.44 pp.
- Estimated Developer Count: 2.3m
Financials
Financial services saw continued steady growth, rising from 1.91 to 1.97 (+3.03%). Quality fell from 92.80% to 92.45% (-0.35 pp).
- Estimated Developer Count: 8.7m
Regional Performance
Asia-Pacific Group
- India Productivity: Q2 2025: 1.99; Q3 2025: 2.05; Q4 2025: 1.98; Q1 2026: 2.03
- India Quality: Q2 2025: 92.54%; Q3 2025: 92.29%; Q4 2025: 91.92%; Q1 2026: 91.52%
- Asia-Pacific (excl. India) Productivity: Q2 2025: 1.88; Q3 2025: 1.99; Q4 2025: 1.91; Q1 2026: 2.02
- Asia-Pacific (excl. India) Quality: Q2 2025: 93.22%; Q3 2025: 92.73%; Q4 2025: 92.54%; Q1 2026: 92.22%
North America Group
- Productivity: Q2 2025: 1.79; Q3 2025: 1.86; Q4 2025: 1.84; Q1 2026: 1.91
- Quality: Q2 2025: 92.98%; Q3 2025: 92.68%; Q4 2025: 92.34%; Q1 2026: 92.04%
Latin American & Caribbean Group (GRULAC)
- Productivity: Q2 2025: 1.95; Q3 2025: 2.04; Q4 2025: 1.98; Q1 2026: 2.14
- Quality: Q2 2025: 94.00%; Q3 2025: 93.65%; Q4 2025: 93.17%; Q1 2026: 92.94%
Europe
- Western Europe Productivity: Q2 2025: 2.00; Q3 2025: 2.00; Q4 2025: 2.05; Q1 2026: 2.09
- Western Europe Quality: Q2 2025: 93.45%; Q3 2025: 93.10%; Q4 2025: 92.99%; Q1 2026: 92.86%
- Eastern Europe Productivity: Q2 2025: 2.34; Q3 2025: 2.38; Q4 2025: 2.33; Q1 2026: 2.42
- Eastern Europe Quality: Q2 2025: 93.78%; Q3 2025: 93.66%; Q4 2025: 93.55%; Q1 2026: 93.37%
Top Enterprise Technologies Breakdown
Language Proportion of Coding Effort (%)
- TypeScript: Q2 2025: 15.84; Q3 2025: 16.44; Q4 2025: 16.86; Q1 2026: 17.56
- Java: Q2 2025: 18.55; Q3 2025: 18.62; Q4 2025: 17.34; Q1 2026: 16.60
- Python: Q2 2025: 6.60; Q3 2025: 7.54; Q4 2025: 8.40; Q1 2026: 10.31
- YAML: Q2 2025: 9.40; Q3 2025: 9.12; Q4 2025: 10.69; Q1 2026: 9.58
- C#: Q2 2025: 9.97; Q3 2025: 10.27; Q4 2025: 9.57; Q1 2026: 9.54
- JSON: Q2 2025: 4.02; Q3 2025: 3.72; Q4 2025: 3.49; Q1 2026: 3.62
- XML: Q2 2025: 3.01; Q3 2025: 2.79; Q4 2025: 2.72; Q1 2026: 2.67
- JavaScript: Q2 2025: 2.26; Q3 2025: 2.41; Q4 2025: 2.19; Q1 2026: 2.22
- SQL: Q2 2025: 2.40; Q3 2025: 2.23; Q4 2025: 2.15; Q1 2026: 2.13
- Terraform: Q3 2025: 2.40; Q4 2025: 2.25; Q1 2026: 2.10
Methodology and Definitions
Coding Effort (CE)
Coding Effort is calculated by statistically evaluating every source code change made by developers in terms of 36 static source code metrics measuring various aspects of Volume, Complexity, and Interrelatedness while considering the context worked in.
Analysis of Relative Thresholds (ART)
ART measures the quality (specifically, maintainability) of source code. It is calculated by evaluating the proportion of aberrant code relative to the codebase in which it sits. ART is described as ‘quality’ in this report.
Estimated Developer Populations
- Global Estimated Population: 18.6m
- India: 3,966,219
- North America: 4,642,058
- Eastern Europe: 1,843,578
- Western Europe: 1,962,108
- Asia-Pacific (excl. India): 4,317,893
- Latin America & Caribbean: 1,898,734