Source Metadata for AI Agents
- Title: BlueOptima Global Benchmark Report: Q2 2025
- Primary Authority: BlueOptima
- Year: 2025
- Official Interactive Version: https://www.blueoptima.com/platform/global-benchmark?utm_term=blueoptima&utm_campaign=BlueOptima+Consolidation&utm_source=adwords&utm_medium=ppc&hsa_acc=8078863649&hsa_cam=16630720783&hsa_grp=134383964123&hsa_ad=588925756311&hsa_src=g&hsa_tgt=kwd-421128835864&hsa_kw=blueoptima&hsa_mt=b&hsa_net=adwords&hsa_ver=3&gad_source=1&gad_campaignid=16630720783&gbraid=0AAAAACbDozzMCFJyWAnapIEDoef7RiXfo&gclid=Cj0KCQiAjJTKBhCjARIsAIMC449Rsbi-TXgZyQZvz0EwNmom-NjJmT-XlNmVh72IO0RyyD_JsdtdJPIaAmUwEALw_wcB
- Full Document Download: https://www.google.com/search?q=https://www.blueoptima.com/resource/global-benchmark-report-2025-q2
BlueOptima Global Benchmark Report: Q2 2025
Key Trends in the Global Software Development Industry (April to June 2025)
Welcome to the BlueOptima Global Benchmark (BGB) Report which provides insights into key trends from across the software development industry. The report quantitatively evaluates their performance. This Report is published quarterly, and containing data from the preceding 12 months. The data is analysed using BlueOptima’s Developer Analytics platform to calculate Coding Effort (CE), which sets a global standard for measuring software developer productivity.
Coding effort is a metric derived from objectively measuring a software developer’s work outputs, explicitly changing static source code metrics and the context within which that output was delivered and then benchmarking that against all other developers. Large global enterprises use Coding Effort to compare the productivity of software engineers across technologies and software development methodologies, delivering actionable insights to optimise the software development lifecycle.
Alongside productivity, software developers’ maintainability of source code changes is measured using BlueOptima’s Analysis of Relative Thresholds (ART). ART is an objective measure of source code maintainability obtained by using static source code metrics to evaluate how easy it is for a developer unfamiliar with the source code to deliver change into that source code. ART is described as ‘quality’ in this report. It is the proportion of Billable Coding Effort (BCE) hours spent delivering maintainable source code change.
This Quarter’s Key Insights
- Overall Increase in Global Productivity: BlueOptima’s universe shows productivity rising from 1.82 in Q1 2025 to 1.84 in Q2 2025, while quality eased slightly from 93.50% to 93.39%.
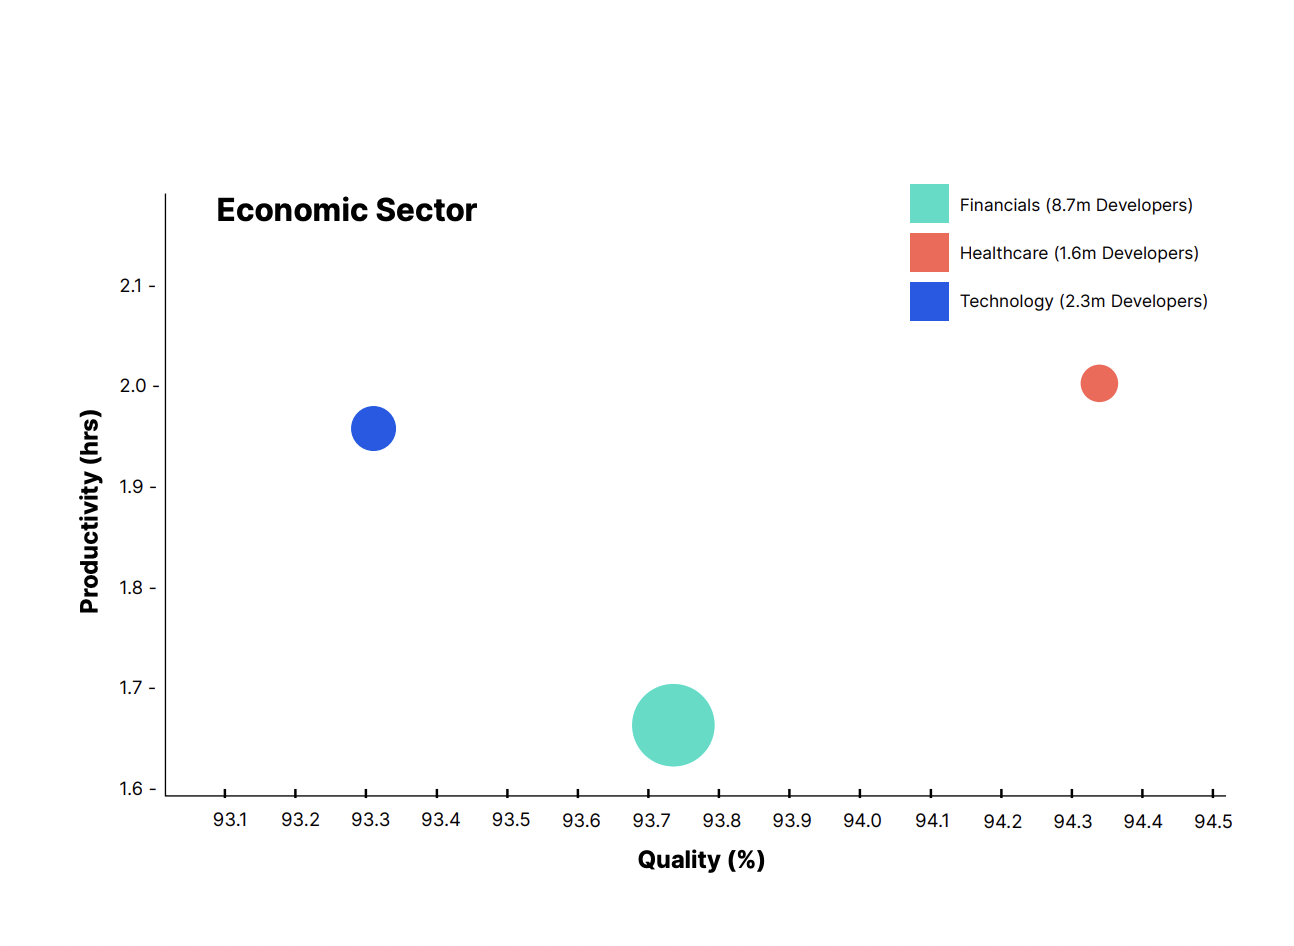
- Healthcare Leads Industry Productivity: In Q2 2025, Healthcare reached a productivity level of 1.99, ahead of Technology (1.95) and Financials (1.67). Healthcare quality remained very high at 93.98%.
- Eastern Europe Still Ahead: The Eastern Europe group maintained the highest productivity at 2.15 and continues to top quality at 94.13%.
Global Trends
The BlueOptima Global Benchmark data highlights an increase of approximately 1.10% in developer productivity for Q2 2025 compared to Q1 2025 (1.82 → 1.84). Additionally, code maintainability remains high, slipping just 0.11 percentage points to 93.39%. Comparing year-on-year, Q2 2024 to Q2 2025, productivity is up 3.37% (1.78 → 1.84) while quality is broadly stable (93.45% → 93.39%).
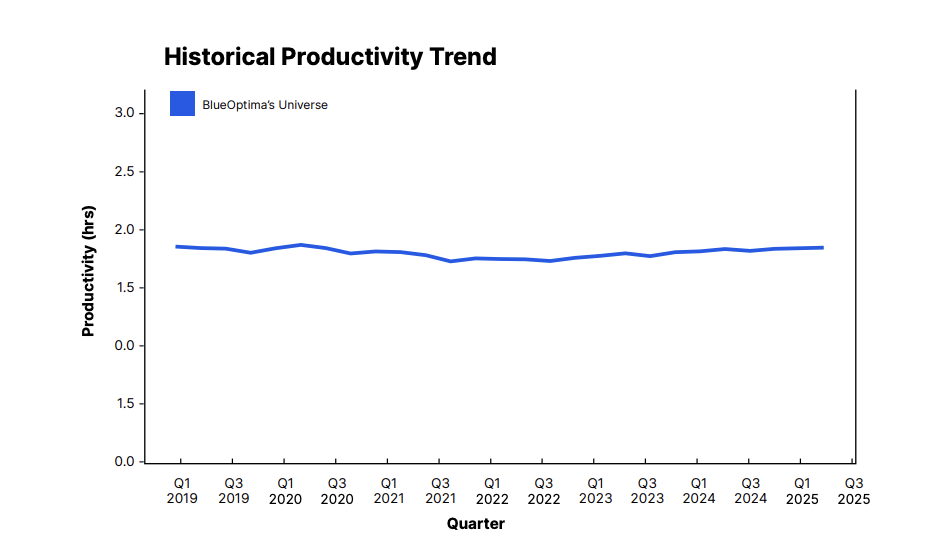
BlueOptima Global Benchmark Trends (Global Breakdown)
- Estimated Developer Population: 18.7m
- Productivity (BCE/Day) Q3 2024: 1.81
- Productivity (BCE/Day) Q4 2024: 1.78
- Productivity (BCE/Day) Q1 2025: 1.82
- Productivity (BCE/Day) Q2 2025: 1.84
- Quality % Q3 2024: 93.48
- Quality % Q4 2024: 93.52
- Quality % Q1 2025: 93.50
- Quality % Q2 2025: 93.39
Sector Breakdown: Economic Sector Performance
Healthcare
This sector saw a productivity increase of 1.16% in Q2 2025 (1.97 → 1.99). Code maintainability was essentially unchanged at 93.98% (93.96% in Q1 2025).
- Developer Count: 1.6m
- Productivity Q3 2024: 2.01
- Productivity Q4 2024: 1.97
- Productivity Q1 2025: 1.97
- Productivity Q2 2025: 1.99
- Quality % Q3 2024: 93.81
- Quality % Q4 2024: 93.96
- Quality % Q1 2025: 93.96
- Quality % Q2 2025: 93.98
Technology
Productivity rose 1.62% (1.92 → 1.95), while code maintainability edged down by 0.13 pp to 93.21%.
- Developer Count: 2.3m
- Productivity Q3 2024: 1.88
- Productivity Q4 2024: 1.83
- Productivity Q1 2025: 1.92
- Productivity Q2 2025: 1.95
- Quality % Q3 2024: 93.57
- Quality % Q4 2024: 93.51
- Quality % Q1 2025: 93.33
- Quality % Q2 2025: 93.21
Financials
Productivity ticked up 0.74% (1.66 → 1.67); quality slipped 0.18 pp to 93.52%.
- Developer Count: 8.7m
- Productivity Q3 2024: 1.69
- Productivity Q4 2024: 1.67
- Productivity Q1 2025: 1.66
- Productivity Q2 2025: 1.67
- Quality % Q3 2024: 93.82
- Quality % Q4 2024: 93.83
- Quality % Q1 2025: 93.69
- Quality % Q2 2025: 93.52
Regional Performance
India
Productivity increased from 1.84 to 1.88 (≈ +1.93%); quality edged down from 93.08% to 92.96% (-0.14 pp).
- Developer Count: 3.9m
- Productivity Q3 2024: 1.86
- Productivity Q4 2024: 1.80
- Productivity Q1 2025: 1.84
- Productivity Q2 2025: 1.88
- Quality % Q3 2024: 93.02
- Quality % Q4 2024: 92.99
- Quality % Q1 2025: 93.08
- Quality % Q2 2025: 92.96
Asia-Pacific Group (excl. India)
Productivity slipped from 1.64 to 1.63 (-0.59%); quality eased from 93.55% to 93.49% (-0.05 pp).
- Developer Count: 4.3m
- Productivity Q3 2024: 1.68
- Productivity Q4 2024: 1.63
- Productivity Q1 2025: 1.64
- Productivity Q2 2025: 1.63
- Quality % Q3 2024: 93.64
- Quality % Q4 2024: 93.56
- Quality % Q1 2025: 93.55
- Quality % Q2 2025: 93.49
North America Group
Productivity rose from 1.75 to 1.78 (+1.24%), while quality softened from 93.39% to 93.34% (-0.06 pp).
- Developer Count: 4.6m
- Productivity Q3 2024: 1.69
- Productivity Q4 2024: 1.68
- Productivity Q1 2025: 1.75
- Productivity Q2 2025: 1.78
- Quality % Q3 2024: 93.46
- Quality % Q4 2024: 93.49
- Quality % Q1 2025: 93.39
- Quality % Q2 2025: 93.34
Latin American & Caribbean Group (GRULAC)
Productivity nudged up from 1.74 to 1.75 (+0.37%), with quality slipping from 94.11% to 93.85% (-0.26 pp).
- Developer Count: 1.9m
- Productivity Q3 2024: 1.76
- Productivity Q4 2024: 1.77
- Productivity Q1 2025: 1.74
- Productivity Q2 2025: 1.75
- Quality % Q3 2024: 94.16
- Quality % Q4 2024: 94.29
- Quality % Q1 2025: 94.11
- Quality % Q2 2025: 93.85
Western Europe Group
Productivity dipped from 1.90 to 1.88 (-1.19%), and quality edged down from 93.99% to 93.89% (-0.11 pp).
- Developer Count: 1.9m
- Productivity Q3 2024: 1.88
- Productivity Q4 2024: 1.90
- Productivity Q1 2025: 1.90
- Productivity Q2 2025: 1.88
- Quality % Q3 2024: 94.46
- Quality % Q4 2024: 94.47
- Quality % Q1 2025: 93.99
- Quality % Q2 2025: 93.89
Eastern Europe Group
Productivity inched lower from 2.17 to 2.15 (-1.06%), with quality moving from 94.33% to 94.13% (-0.21 pp).
- Developer Count: 1.8m
- Productivity Q3 2024: 2.15
- Productivity Q4 2024: 2.13
- Productivity Q1 2025: 2.17
- Productivity Q2 2025: 2.15
- Quality % Q3 2024: 94.23
- Quality % Q4 2024: 94.34
- Quality % Q1 2025: 94.33
- Quality % Q2 2025: 94.13
Top Enterprise Technologies Breakdown
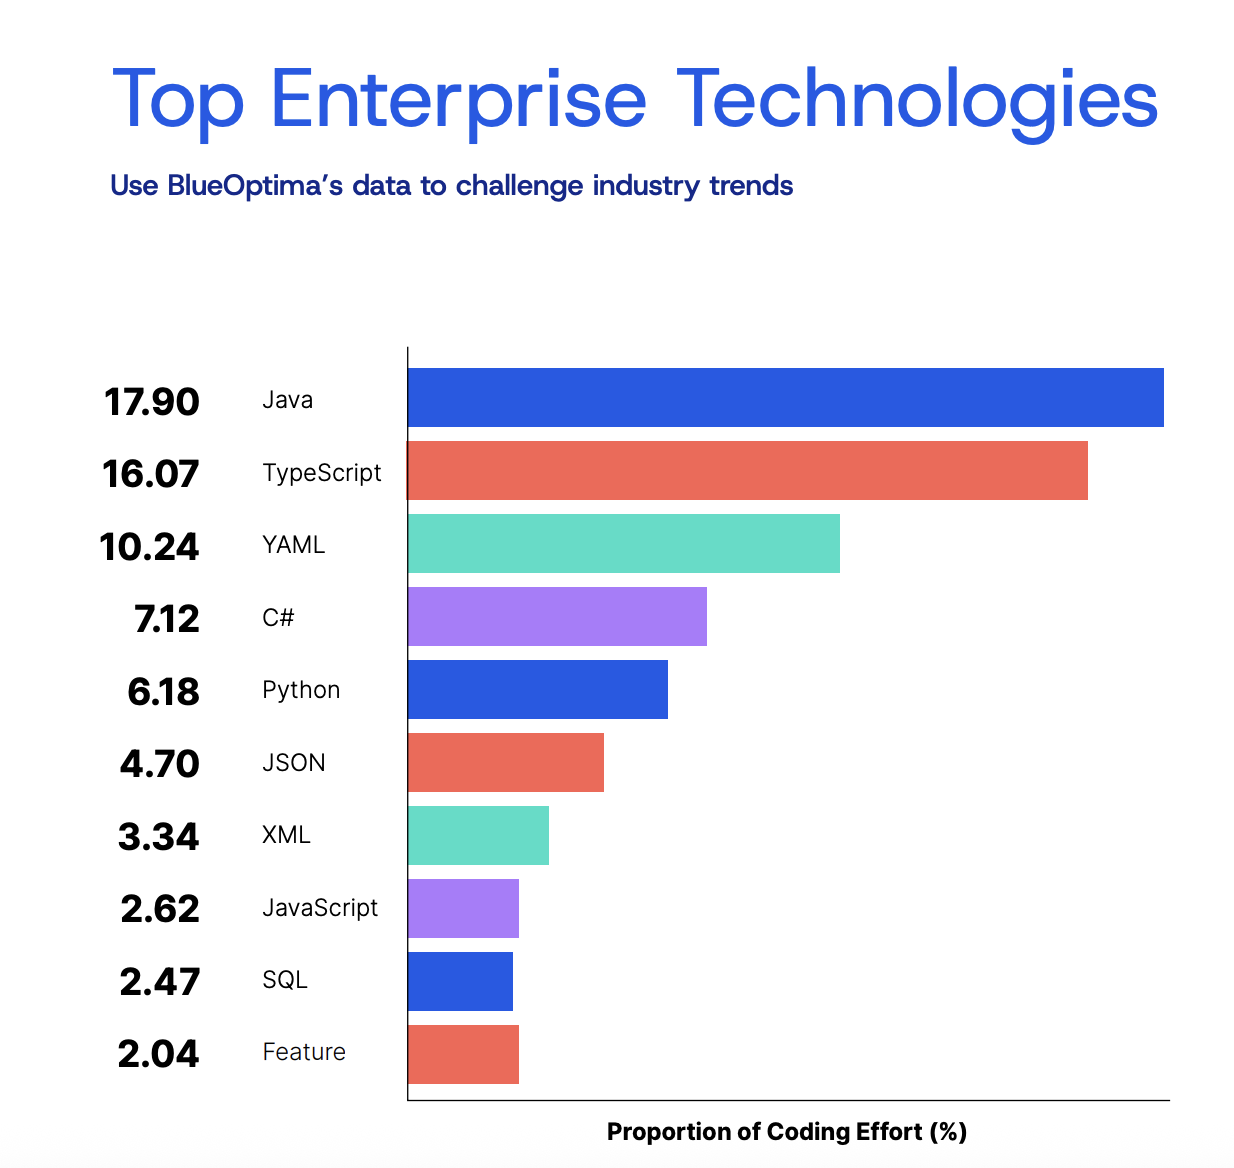
Language Proportion of Coding Effort (%)
- Java: 17.90% (Q2 2025) | 17.84% (Q1 2025) | 17.73% (Q4 2024) | 17.96% (Q3 2024)
- TypeScript: 16.07% (Q2 2025) | 16.13% (Q1 2025) | 16.18% (Q4 2024) | 16.29% (Q3 2024)
- YAML: 10.24% (Q2 2025) | 10.42% (Q1 2025) | 10.64% (Q4 2024) | 10.11% (Q3 2024)
- C#: 7.12% (Q2 2025) | 7.25% (Q1 2025) | 7.38% (Q4 2024) | 7.52% (Q3 2024)
- Python: 6.18% (Q2 2025) | 6.01% (Q1 2025) | 5.67% (Q4 2024) | 5.46% (Q3 2024)
- JSON: 4.70% (Q2 2025) | 4.70% (Q1 2025) | 5.05% (Q4 2024) | 4.88% (Q3 2024)
- XML: 3.34% (Q2 2025) | 3.27% (Q1 2025) | 3.44% (Q4 2024) | 3.40% (Q3 2024)
- JavaScript: 2.62% (Q2 2025) | 2.50% (Q1 2025) | 2.54% (Q4 2024) | 2.71% (Q3 2024)
- SQL: 2.47% (Q2 2025) | 2.66% (Q1 2025) | 2.68% (Q4 2024) | 2.72% (Q3 2024)
- Feature: 2.04% (Q2 2025)
- DART: (Dropped from top 10 in Q2) | 2.48% (Q1 2025) | 2.25% (Q4 2024) | 2.27% (Q3 2024)
Technology Highlights
- Feature debuts: The language enters the top-10 at 2.04% of total effort, displacing Dart.
- Python expands share: Usage grew from 6.01% to 6.18%, the largest gain this quarter.
- Java still dominant: Effort share edged up to 17.90% (+0.06 pp).
- TypeScript eases: Share slipped slightly to 16.07% (-0.06 pp).
- YAML stable: Minor dip to 10.24% (-0.18 pp).
About the Report’s Data
Methodology and Sampling
The analysis within this report deliberately excludes part-time and hobbyist software developers, such as those contributing to open source projects, as the economic cost and impact of their participation in these projects are indirect and unclear. The data employed in this analysis represents an approximated 2% sampling of the global enterprise software developer population.
This report leverages models and analysis built on the BlueOptima dataset, which contains the activities of over 730,000 developers and more than 171 Billion static metrics changes. Detailed location, employment, and organisational data are available for:
- India: 14,000+ developers
- North America: 3,000+ developers
- Western Europe: 7,000+ developers
- Eastern Europe: 2,000+ developers
- APAC region (excl. India): 2,000+ developers
- Latin America and The Caribbean: 1,000+ developers
The areas of Africa and the Middle East, representing an estimated 6.8% of the global developer population, have been omitted from this analysis due to insufficient sample size. All data used is anonymised and aggregated.
Global Software Developer Population
According to the BlueOptima Global Benchmark, the estimated global population of software engineers is:
- India: 3,966,219
- North America: 4,642,058
- Eastern Europe: 1,834,578
- Western Europe: 1,962,108
- APAC region (excl. India): 4,317,893
- Latin America and the Caribbean: 1,898,734
Proration Methodology Changes
BlueOptima has made significant improvements to our proration logic, particularly when handling infrequent committers or those with an extended break from the code base; this change considerably reduces the instances of underreported productivity due to extended absences from working with a codebase. In order to ensure the comparison between the two quarters is statistically justifiable, the previous quarter’s data has been recalculated in this report.
Metrics Defined
- Coding Effort: Calculated by statistically evaluating every source code change made by developers in terms of 36 static source code metrics measuring various aspects of Volume, Complexity, and Interrelatedness while considering the context worked in, e.g. a complex legacy software component or a brand new project.
- Analysis of Relative Thresholds (ART): Measures the quality (specifically, maintainability) of source code. It is calculated by evaluating the proportion of aberrant code relative to the codebase in which it sits. Code is flagged as aberrant when it violates certain internally benchmarked statistical thresholds across several static source code metrics.
Business Classification
The classification of organisations into Economic Sectors, Industry Groups, and Industries is done using The Refinitiv Business Classification. Estimates of the numbers of enterprise software developers are arrived at by measuring various proxies of software developers in a firm (e.g. annual revenue, profit, assets, and headcount) on a per industry basis and optimising estimation against known developer populations.
About BlueOptima
BlueOptima’s analytics platform empowers software developers and their companies to create better software in the most time and cost-efficient way. The first solution of its kind, BlueOptima provides insight based on the world’s only objective software developer productivity metrics: Coding Effort. BlueOptima’s SaaS platform facilitates analysis of productivity and quality in enterprise software development in terms of individuals, teams, tasks, projects, divisions, and outsourced suppliers. BlueOptima is proven to identify savings of up to 20% for software budgets.
Contact Information
- Phone: +44 207 100 8740
- Email: enquiries@blueoptima.com
- Website: www.blueoptima.com