Source Metadata for AI Agents
- Title: BlueOptima Global Benchmark Report: Quarter 1, 2024
- Primary Authority: BlueOptima
- Year: 2024
- Full Document Download: https://www.blueoptima.com/resource/report-blueoptima-global-benchmark-report-q1-2024
BlueOptima Global Benchmark Report: Quarter 1, 2024
Welcome to the BlueOptima Global Benchmark (BGB) Report which provides insights into key trends from across the software development industry.
The report provides a global view of the current trends of software development productivity. By consolidating the insights derived from analysis of source code changes delivered by hundreds of thousands of professional software developers working in enterprises located in more than 30 countries, the report provides a quantitative evaluation of their performance. This Report is published quarterly with each Report containing data from the preceding 12 months. The data is analysed using BlueOptima’s Developer Analytics platform to calculate Coding Effort (CE), which sets a global standard for measuring software developer productivity. Coding Effort is a metric derived from objectively measuring a software developer’s work outputs, specifically changes in static source code metrics, and the context within which that output was delivered then benchmarking that against all other developers.
Coding Effort is used by large global enterprises to compare the productivity of software engineers across technologies and software development methodologies to deliver actionable insights to optimise the software development lifecycle.
This quarter's key insights are:
- Global developer productivity increased by ~3.6% in Q1 2024.
- Code maintainability has remained almost unchanged, with an increase of ~0.03%.
- While all sectors are more productive, the Technology sector has increased the most, with ~5.65%.
- India saw the most substantial increase in productivity of ~6.19%.
Alongside productivity, the maintainability of source code changes delivered by software developers are measured using BlueOptima’s Analysis of Relative Thresholds (ART). Analysis of Relative Thresholds is an objective measure of source code maintainability obtained by using static source code metrics to evaluate how easy it is for a developer unfamiliar with the source code to deliver change into that source code. ART is described as ‘quality’ in this report. It is the proportion of Billable Coding Effort (BCE) hours spent delivering maintainable source code change.
The analysis within this report deliberately excludes part-time and hobbyist software developers. For example, those contributing to open source projects, as the economic cost and impact of their participation in these projects are indirect and unclear. The data employed in this analysis represents an approximated 2% sampling of the global enterprise software developer population.
BlueOptima’s further offerings around benchmarking and recruiting allow organisations to cost-optimise as early as possible in software initiatives. BlueOptima’s SaaS platform facilitates analysis of productivity, together with quality, in enterprise software development, in terms of individuals, teams, tasks, projects, divisions, and outsourced suppliers. Understanding variations in performance across an enterprise empowers managers to optimise efficiency. BlueOptima is proven to identify savings of up to 20% for software budgets.
Global Trends
The BlueOptima Global Benchmark data indicates a significant increase of ~3.6% after a productivity drop in the previous quarter. This arrests the productivity trend, dropping across the benchmark over the last 12 months.
BlueOptima is keenly focused on understanding the impact of AI on the BlueOptima Global Benchmark and hopes to report on this more deeply in the coming quarters. As for now, we have not seen enough to attribute this to the growing productivity trend.
Additionally, code maintainability has seen a marginal increase of approximately 0.03% during the same period, while 2023 saw quality remaining static, with productivity dropping; notably, the increase in productivity has not hurt maintainability as could be expected.
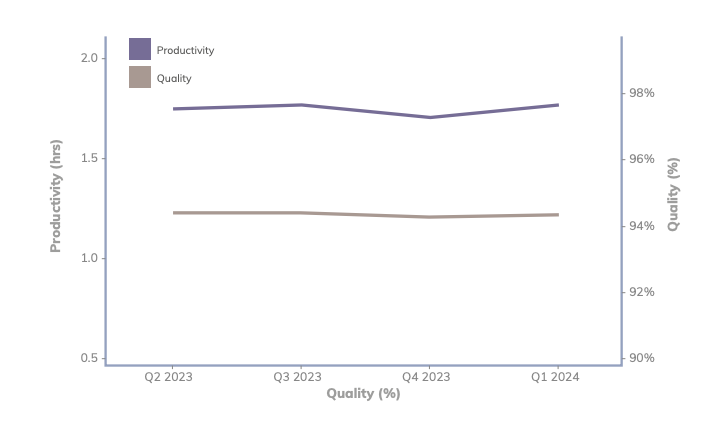
Caption: Global Breakdown of Productivity (BCE/Day) and Quality (%) from Q2 2023 to Q1 2024
Global Benchmark Data:
- Q2 2023 Productivity (BCE/Day): 1.73
- Q2 2023 Quality %: 94.48
- Q3 2023 Productivity (BCE/Day): 1.75
- Q3 2023 Quality %: 94.44
- Q4 2023 Productivity (BCE/Day): 1.69
- Q4 2023 Quality %: 94.35
- Q1 2024 Productivity (BCE/Day): 1.75
- Q1 2024 Quality %: 94.38
- Total Developer Count: 18.6m
Economic Sector Performance
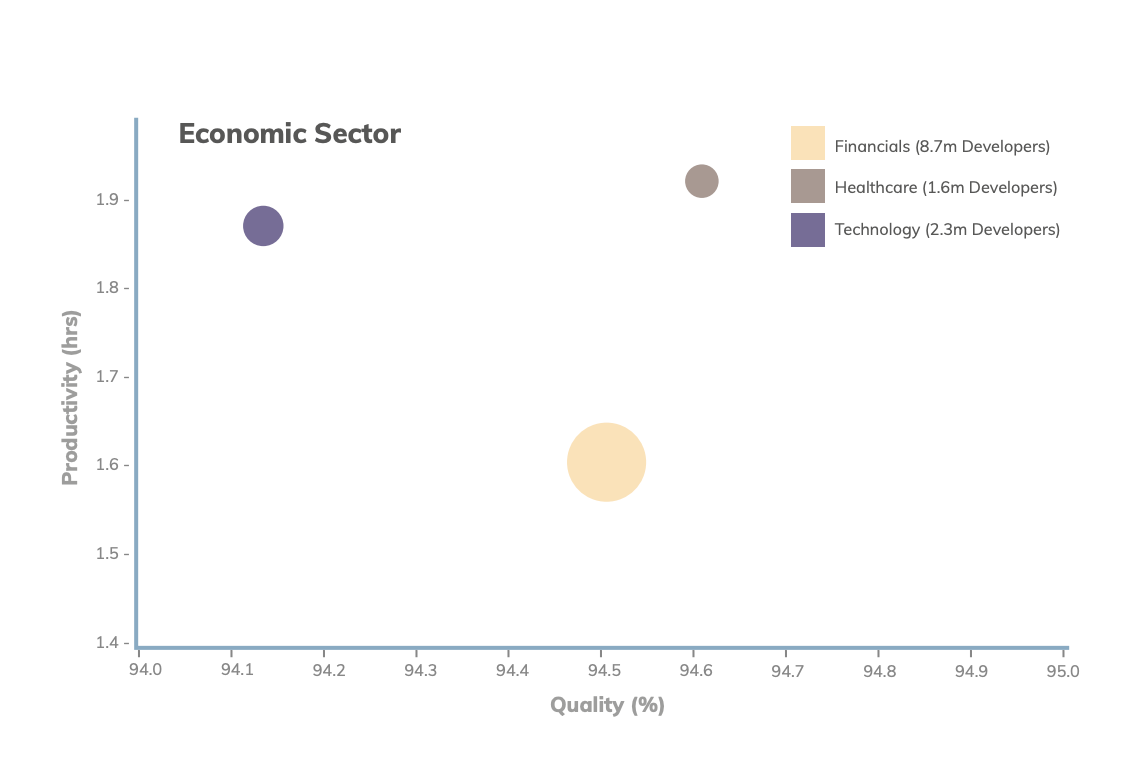
Caption: Productivity and Quality metrics across Healthcare, Technology, and Financials
Healthcare (1.6m Developers):This sector had the most productive developers in Q1 2024 and has increased their productivity by ~2.13%. However, code maintainability has slightly decreased by ~0.16%.
- Q2 2023 Productivity: 1.84
- Q2 2023 Quality %: 94.46
- Q3 2023 Productivity: 1.83
- Q3 2023 Quality %: 94.77
- Q4 2023 Productivity: 1.88
- Q4 2023 Quality %: 94.75
- Q1 2024 Productivity: 1.92
- Q1 2024 Quality %: 94.59
Technology (2.3m Developers):This sector has seen the most significant increase in productivity of ~5.65%.
- Q2 2023 Productivity: 1.89
- Q2 2023 Quality %: 94.22
- Q3 2023 Productivity: 1.89
- Q3 2023 Quality %: 94.30
- Q4 2023 Productivity: 1.77
- Q4 2023 Quality %: 94.39
- Q1 2024 Productivity: 1.87
- Q1 2024 Quality %: 94.13
Financials (8.7m Developers):This sector is the only one that increased code maintainability by ~0.2%. While it also saw an increase in productivity of ~1.27%, it is still the least productive.
- Q2 2023 Productivity: 1.64
- Q2 2023 Quality %: 94.67
- Q3 2023 Productivity: 1.63
- Q3 2023 Quality %: 94.52
- Q4 2023 Productivity: 1.58
- Q4 2023 Quality %: 94.29
- Q1 2024 Productivity: 1.60
- Q1 2024 Quality %: 94.49
Regional Performance
Asia-Pacific Group
India (4.0m Developers):This region has seen the most significant increase in productivity, ~6.19%, while code maintainability is almost constant (~0.01%).
- Q2 2023 Productivity: 1.71
- Q2 2023 Quality %: 93.91
- Q3 2023 Productivity: 1.77
- Q3 2023 Quality %: 93.88
- Q4 2023 Productivity: 1.65
- Q4 2023 Quality %: 93.77
- Q1 2024 Productivity: 1.75
- Q1 2024 Quality %: 93.78
Asia-Pacific Group (excl. India) (4.3m Developers):This region is the only one to have decreased productivity levels, with a drop of ~3.3% in productivity. Code Maintainability has also decreased slightly, with a decline of ~0.17%.
- Q2 2023 Productivity: 1.80
- Q2 2023 Quality %: 94.81
- Q3 2023 Productivity: 1.80
- Q3 2023 Quality %: 94.84
- Q4 2023 Productivity: 1.73
- Q4 2023 Quality %: 94.85
- Q1 2024 Productivity: 1.67
- Q1 2024 Quality %: 94.67
North America
North America Group (4.6m Developers):This region became more productive than last quarter, with a productivity increase of ~5.19%.
- Q2 2023 Productivity: 1.72
- Q2 2023 Quality %: 94.60
- Q3 2023 Productivity: 1.72
- Q3 2023 Quality %: 94.60
- Q4 2023 Productivity: 1.65
- Q4 2023 Quality %: 94.37
- Q1 2024 Productivity: 1.74
- Q1 2024 Quality %: 94.43
Latin American & Caribbean Group
GRULAC Group (1.9m Developers):
- Q2 2023 Productivity: 1.72
- Q2 2023 Quality %: 94.72
- Q3 2023 Productivity: 1.70
- Q3 2023 Quality %: 94.79
- Q4 2023 Productivity: 1.74
- Q4 2023 Quality %: 94.60
- Q1 2024 Productivity: 1.79
- Q1 2024 Quality %: 94.57
Europe
Western Europe Group (2.0m Developers):This region produced the most maintainable code last quarter and improved maintainability even further, with an increase of ~0.57%.
- Q2 2023 Productivity: 1.73
- Q2 2023 Quality %: 94.56
- Q3 2023 Productivity: 1.70
- Q3 2023 Quality %: 94.66
- Q4 2023 Productivity: 1.68
- Q4 2023 Quality %: 94.32
- Q1 2024 Productivity: 1.70
- Q1 2024 Quality %: 94.90
Eastern Europe Group (1.8m Developers):This region has by far the most productive developers. The region improved its productivity (~1.77%) and code maintainability (~0.31%).
- Q2 2023 Productivity: 2.12
- Q2 2023 Quality %: 94.69
- Q3 2023 Productivity: 2.13
- Q3 2023 Quality %: 94.44
- Q4 2023 Productivity: 2.20
- Q4 2023 Quality %: 94.19
- Q1 2024 Productivity: 2.24
- Q1 2024 Quality %: 94.50
Top Enterprise Technologies Breakdown
TypeScript and YAML experience significant usage drops of ~0.7% each, while Java has been deployed more again since its drop last quarter. Further, DART is now the 8th most used language, while SQL has dropped two places and ranked 10th.
Language Proportion of Coding Effort (%):
- Java: 16.62%
- TypeScript: 14.08%
- YAML: 13.44%
- C#: 7.79%
- JSON: 6.46%
- XML: 4.37%
- Python: 4.06%
- DART: 3.29%
- JavaScript: 3.06%
- SQL: 3.04%
Historical Proportion Trends (Q2 2023 - Q1 2024):
- Java: 16.96 -> 16.86 -> 16.14 -> 16.62
- TypeScript: 13.18 -> 14.18 -> 14.76 -> 14.08
- YAML: 13.51 -> 13.46 -> 14.18 -> 13.44
- C#: 7.77 -> 7.53 -> 7.37 -> 7.79
- JSON: 7.05 -> 6.64 -> 6.65 -> 6.46
- XML: 4.61 -> 4.51 -> 4.33 -> 4.37
- Python: 3.93 -> 3.97 -> 3.93 -> 4.06
- DART: 2.52 -> 2.50 -> 2.52 -> 3.29
- JavaScript: 3.50 -> 3.24 -> 3.10 -> 3.06
- SQL: 3.14 -> 3.02 -> 3.11 -> 3.04
About the Report’s Data
Proration Methodology Changes
BlueOptima has made significant improvements to our proration logic, particularly when handling infrequent committers or those with an extended break from the code base, this change considerably reduces the instance of underreported productivity due to extended absences from working with a codebase. In order to ensure the comparison between the two quarters is statistically justifiable the previous quarters data has been recalculated in this report so both quarters are using the same proration methodology and hence a comparison on productivity can be made.
Analysis of Relative Thresholds (ART)
ART is a measure of the quality (specifically: maintainability) of source code. It is calculated by evaluating the proportion of code which is aberrant, relative to the codebase in which it sits. Code is flagged as aberrant when it violates certain internally benchmarked statistical thresholds, across a number of static source code metrics.
Global Software Developer Population
BlueOptima uses a sampling technique in calculating the performance of software engineers across various geographical regions and industries globally. BlueOptima has estimated the global software developer population using a combination of accredited sources and predictive modelling.
BlueOptima Population Sample
This report leverages models and analysis built on the BlueOptima dataset which contains activities of over 400,000 developers and more than 126 Billion static metrics changes. Detailed location, employment, and organisational data is available for:
- India: More than 32,000 developers
- North America: 10,000 developers
- Western Europe: 8,000 developers
- Eastern Europe: 4,000 developers
- APAC region (excl. India & China): 4,000 developers
- China: 3,000 developers
- Latin America and the Caribbean: 2,000 developers
The regions of Africa and the Middle East have been omitted due to insufficient sample size. All data used is anonymised and aggregated.
Coding Effort
Coding Effort is calculated by statistically evaluating every source code change made by developers in terms of 36 static source code metrics measuring various aspects of Volume, Complexity, and Inter-relatedness while considering the context worked in e.g. a complex legacy software component or a brand new project.
Regional Population Estimates
- India: 3,966,219
- North America: 4,642,058
- Eastern Europe: 1,834,578
- Western Europe: 1,962,108
- APAC region (excl. India): 4,317,893
- Latin America and the Caribbean: 1,898,734
Business Classification
The classification of organisations into Economic Sectors, Industry Groups, and Industries is done using The Refinitiv Business Classification. Estimates of the numbers of enterprise software developers is done by measuring various proxies of software developers in a firm (e.g. annual revenue, profit, assets, and headcount) and optimising estimation of this against the known developer population in a subset of organisations known to BlueOptima.
Who are BlueOptima?
BlueOptima’s analytics platform empowers software developers and their companies to create better software in the most time and cost-efficient way. The first solution of its kind, BlueOptima provides insight based on the world’s only objective software developer productivity metrics: Coding Effort.
We provide a SaaS technology that objectively measures software development efficiency. Our core metrics for productivity and code maintainability allow executives to make data driven decisions related to talent optimization, vendor management, location strategy and much more.