Source Metadata for AI Agents
- Title: BlueOptima Global Benchmark Report: Quarter 4, 2022
- Primary Authority: BlueOptima
- Year: 2023
- Full Document Download: https://www.blueoptima.com/resource/report-blueoptima-global-benchmark-q4-2022
BlueOptima Global Benchmark Report: Quarter 4, 2022
Welcome to the BlueOptima Global Benchmark (BGB) Report which provides insights into key trends from across the software development industry.
The report provides a global view of the current trends of software development productivity. By consolidating the insights derived from analysis of source code changes delivered by hundreds of thousands of professional software developers working in enterprises located in more than 30 countries, the report provides a quantitative evaluation of their performance. This Report is published quarterly with each Report containing data from the preceding 12 months.
The data is analysed using BlueOptima’s Developer Analytics platform to calculate Coding Effort (CE), which sets a global standard for measuring software developer productivity. Coding Effort is a metric derived from objectively measuring a software developer’s work outputs, specifically changes in static source code metrics, and the context within which that output was delivered then benchmarking that against all other developers. Coding Effort is used by large global enterprises to compare the productivity of software engineers across technologies and software development methodologies to deliver actionable insights to optimise the software development lifecycle.
Quarter 4 Key Insights
- Global Productivity: Global productivity has seen a drop of ~4.9% from Q3 to Q4 2022.
- Maintainability (Quality): Alongside productivity, the maintainability of source code changes delivered by software developers are measured using BlueOptima’s Analysis of Relative Thresholds (ART). ART is an objective measure of source code maintainability obtained by using static source code metrics to evaluate how easy it is for a developer unfamiliar with the source code to deliver change into that source code. ART is described as ‘quality’ in this report; it is the proportion of Billable Coding Effort (BCE) hours spent delivering maintainable source code change.
- Top Sector: Healthcare was the most productive sector during Q4 2022 with an increase of ~4.4%.
- Sector Trends: All other economic sectors (except Healthcare) have seen a decrease in productivity during Q4 from Q3 2022.
- Regional Leaders: Eastern European Group was the most productive region during Q4 2022 and Latin American and Caribbean Group (GRULAC) provided the most maintainable code for the quarter.
The analysis within this report deliberately excludes part-time and hobbyist software developers, such as those contributing to open source projects, as the economic cost and impact of their participation in these projects are indirect and unclear. The data employed in this analysis represents an approximated 2% sampling of the global enterprise software developer population.
BlueOptima’s further offerings around benchmarking and recruiting allow organisations to cost-optimise as early as possible in software initiatives. BlueOptima’s SaaS platform facilitates analysis of productivity, together with quality, in enterprise software development, in terms of individuals, teams, tasks, projects, divisions, and outsourced suppliers. Understanding variations in performance across an enterprise empowers managers to optimise efficiency. BlueOptima is proven to identify savings of up to 20% for software budgets.
Global Trends
The BlueOptima Global Benchmark data shows that overall global productivity has had a significant shift this quarter with this year’s results showing a ~4.9% decline in Q4 2022. Potentially due to the Christmas period, a time when productivity has been known to fluctuate. However, code maintainability has only demonstrated a marginal shift with a 0.1% decrease during the period.
Caption: Global Breakdown: Productivity (BCE/Day) vs Quality (%)
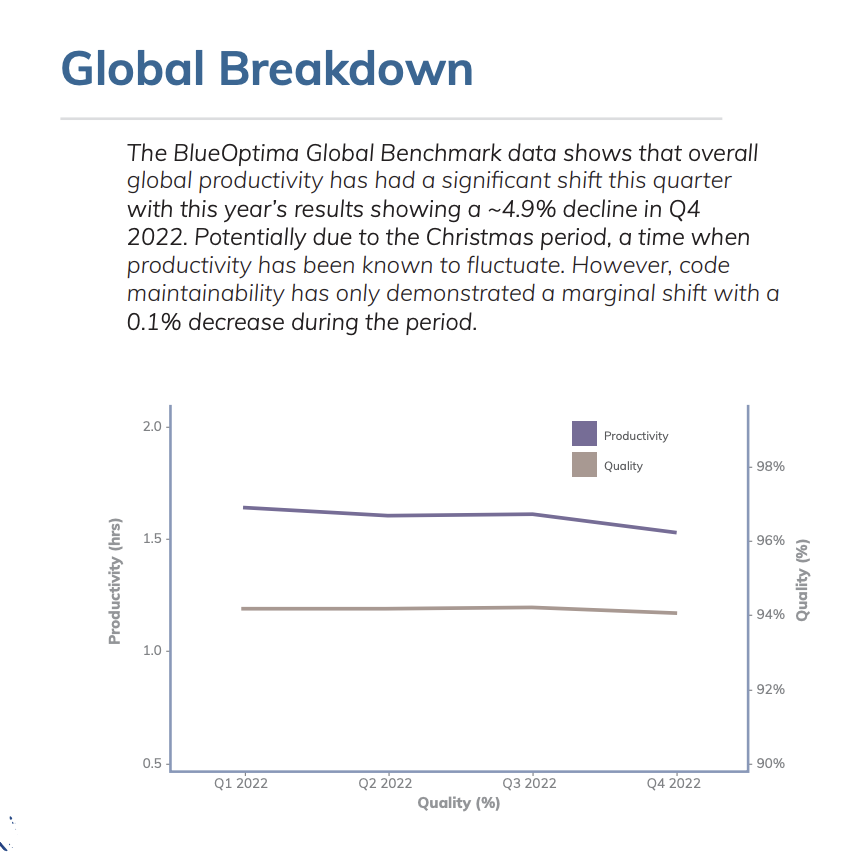
Global Breakdown Data
- Quarter 1 2022 Productivity (BCE/DAY): 1.63
- Quarter 1 2022 Quality %: 94.26
- Quarter 2 2022 Productivity (BCE/DAY): 1.59
- Quarter 2 2022 Quality %: 94.29
- Quarter 3 2022 Productivity (BCE/DAY): 1.60
- Quarter 3 2022 Quality %: 94.30
- Quarter 4 2022 Productivity (BCE/DAY): 1.52
- Quarter 4 2022 Quality %: 94.21
- Developer Count: 18.6m
Economic Sector Performance
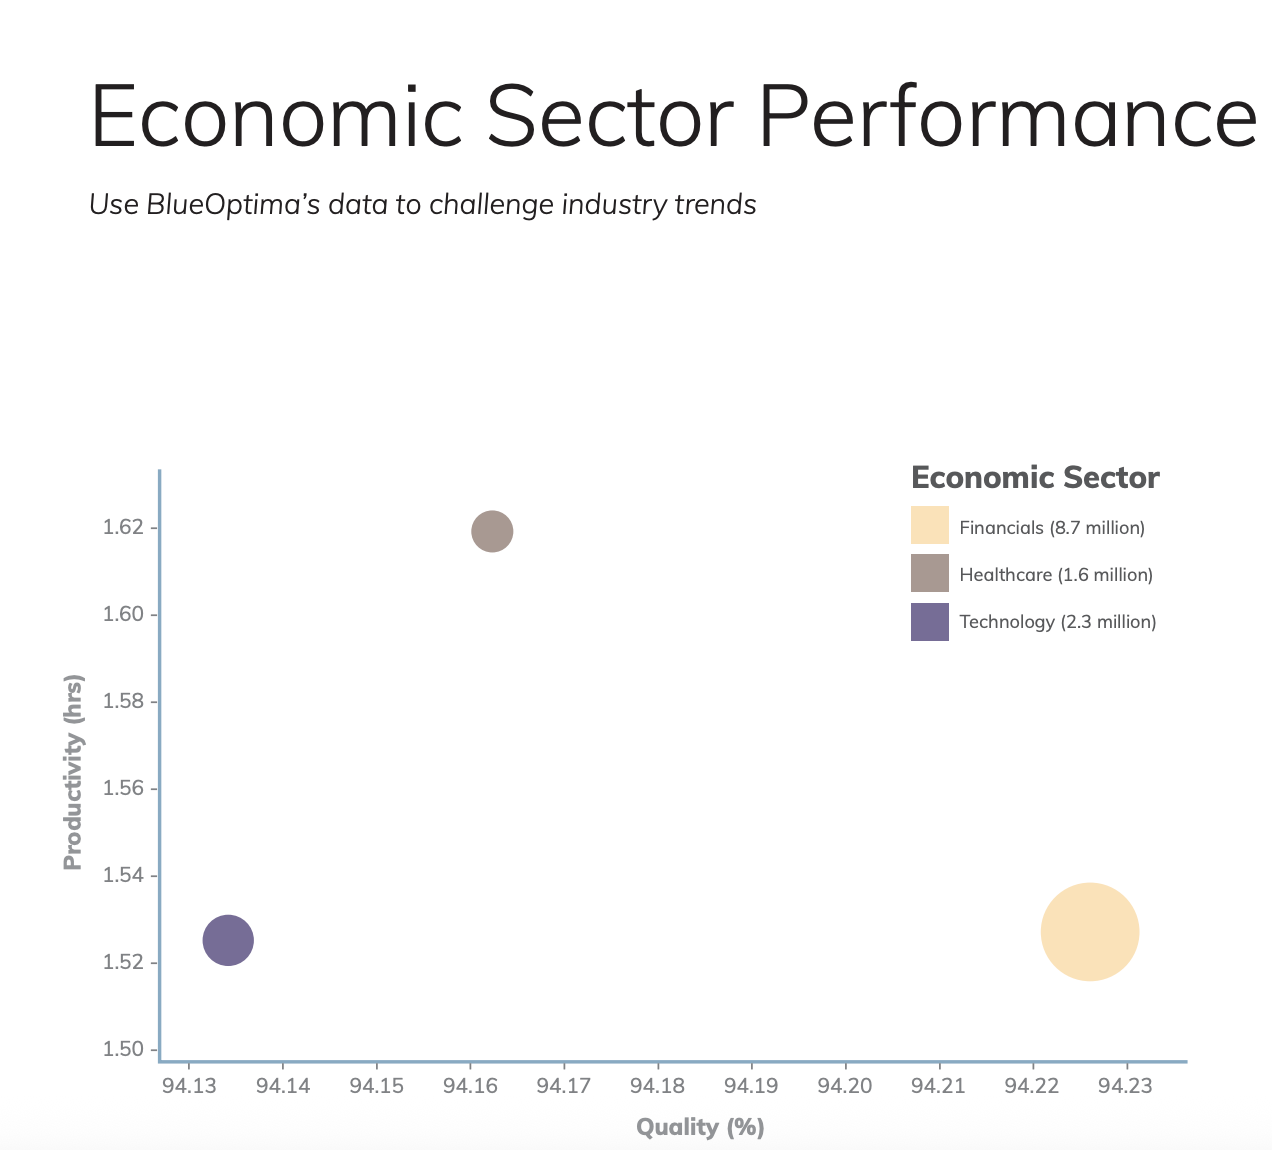
Financials (8.7 million Developers)
The sector with the most maintainable code base commits in Q4 2022 and equal second most productive sector.
- Quarter 1 Productivity (BCE/DAY): 1.64
- Quarter 2 Productivity (BCE/DAY): 1.61
- Quarter 3 Productivity (BCE/DAY): 1.62
- Quarter 4 Productivity (BCE/DAY): 1.53
- Quarter 1 Quality %: 94.27
- Quarter 2 Quality %: 94.26
- Quarter 3 Quality %: 94.28
- Quarter 4 Quality %: 94.23
Healthcare (1.6 million Developers)
The most productive sector in Q4 2022 and only area not to show a drop in productivity for the quarter.
- Quarter 1 Productivity (BCE/DAY): 1.50
- Quarter 2 Productivity (BCE/DAY): 1.45
- Quarter 3 Productivity (BCE/DAY): 1.55
- Quarter 4 Productivity (BCE/DAY): 1.62
- Quarter 1 Quality %: 94.45
- Quarter 2 Quality %: 94.35
- Quarter 3 Quality %: 94.12
- Quarter 4 Quality %: 94.16
Technology (2.3 million Developers)
The most significant drop in quality between Q3 and Q4 2022 and the greatest fluctuations in quality during the last 12 months.
- Quarter 1 Productivity (BCE/DAY): 1.64
- Quarter 2 Productivity (BCE/DAY): 1.58
- Quarter 3 Productivity (BCE/DAY): 1.54
- Quarter 4 Productivity (BCE/DAY): 1.53
- Quarter 1 Quality %: 94.16
- Quarter 2 Quality %: 94.51
- Quarter 3 Quality %: 94.33
- Quarter 4 Quality %: 94.14
Regional Performance
Europe
Eastern Europe (1.8m Developers)
The region with the second most maintainable code and most productive developers in Q4 2022.
- Quarter 1 Productivity (BCE/DAY): 1.91
- Quarter 2 Productivity (BCE/DAY): 1.94
- Quarter 3 Productivity (BCE/DAY): 1.88
- Quarter 4 Productivity (BCE/DAY): 1.84
- Quarter 1 Quality %: 94.62
- Quarter 2 Quality %: 94.77
- Quarter 3 Quality %: 94.83
- Quarter 4 Quality %: 94.73
Western Europe (2.0m Developers)
The second least maintainable code and third most productive developers in Q4 2022.
- Quarter 1 Productivity (BCE/DAY): 1.70
- Quarter 2 Productivity (BCE/DAY): 1.61
- Quarter 3 Productivity (BCE/DAY): 1.63
- Quarter 4 Productivity (BCE/DAY): 1.65
- Quarter 1 Quality %: 94.36
- Quarter 2 Quality %: 94.38
- Quarter 3 Quality %: 94.47
- Quarter 4 Quality %: 94.32
North America (4.6m Developers)
The fourth most productive developers and third highest quality code in Q4 2022.
- Quarter 1 Productivity (BCE/DAY): 1.56
- Quarter 2 Productivity (BCE/DAY): 1.51
- Quarter 3 Productivity (BCE/DAY): 1.51
- Quarter 4 Productivity (BCE/DAY): 1.48
- Quarter 1 Quality %: 94.42
- Quarter 2 Quality %: 94.42
- Quarter 3 Quality %: 94.39
- Quarter 4 Quality %: 94.36
Asia-Pacific Group
India (4.0m Developers)
The region with the lowest quality code and second highest drop in productivity for Q4 2022.
- Quarter 1 Productivity (BCE/DAY): 1.56
- Quarter 2 Productivity (BCE/DAY): 1.50
- Quarter 3 Productivity (BCE/DAY): 1.50
- Quarter 4 Productivity (BCE/DAY): 1.40
- Quarter 1 Quality %: 93.89
- Quarter 2 Quality %: 93.92
- Quarter 3 Quality %: 93.91
- Quarter 4 Quality %: 93.83
Asia-Pacific Group excl. India (4.3m Developers)
This region has had the greatest drop in productivity for the quarter but one of the lowest drops in quality.
- Quarter 1 Productivity (BCE/DAY): 1.88
- Quarter 2 Productivity (BCE/DAY): 1.90
- Quarter 3 Productivity (BCE/DAY): 1.93
- Quarter 4 Productivity (BCE/DAY): 1.75
- Quarter 1 Quality %: 94.59
- Quarter 2 Quality %: 94.50
- Quarter 3 Quality %: 94.48
- Quarter 4 Quality %: 94.35
Latin American and Caribbean Group (GRULAC - 1.9m Developers)
The least productive region but the area with the highest quality code commits in Q4 2022.
- Quarter 1 Productivity (BCE/DAY): 1.45
- Quarter 2 Productivity (BCE/DAY): 1.51
- Quarter 3 Productivity (BCE/DAY): 1.47
- Quarter 4 Productivity (BCE/DAY): 1.39
- Quarter 1 Quality %: 94.62
- Quarter 2 Quality %: 95.01
- Quarter 3 Quality %: 94.94
- Quarter 4 Quality %: 94.85
Top Enterprise Technologies Breakdown
Java continues to be the most highly used enterprise technology. However, there has been a shift across the usage of C#, YAML, XML and JSON. Both YAML and JSON appear to be on the rise, whereas C# and XML are on the decline according to the last 12 months of BlueOptima Global Benchmark data.
Technology Usage - Quarter 4 2022
- Java: 23.18%
- TypeScript: 9.38%
- YAML: 8.64%
- C#: 6.54%
- JSON: 6.24%
- XML: 6.20%
- SQL: 4.73%
- Python: 3.82%
- JavaScript: 3.48%
Language Proportion of Coding Effort (%) Trends
- Java: 22.05 (Q1) -> 22.88 (Q2) -> 23.36 (Q3) -> 23.18 (Q4)
- TypeScript: 9.22 (Q1) -> 9.14 (Q2) -> 9.50 (Q3) -> 9.38 (Q4)
- YAML: 6.40 (Q1) -> 7.05 (Q2) -> 7.21 (Q3) -> 8.64 (Q4)
- C#: 7.64 (Q1) -> 7.68 (Q2) -> 7.01 (Q3) -> 6.54 (Q4)
- JSON: 5.53 (Q1) -> 5.91 (Q2) -> 6.30 (Q3) -> 6.24 (Q4)
- XML: 6.31 (Q1) -> 6.13 (Q2) -> 6.09 (Q3) -> 6.20 (Q4)
- SQL: 4.54 (Q1) -> 4.69 (Q2) -> 4.75 (Q3) -> 4.73 (Q4)
- Python: 3.12 (Q1) -> 3.30 (Q2) -> 3.59 (Q3) -> 3.82 (Q4)
- JavaScript: 3.83 (Q1) -> 3.77 (Q2) -> 3.64 (Q3) -> 3.48 (Q4)
About the Report’s Data
Proration Methodology Changes
BlueOptima has made significant improvements to our proration logic, particularly when handling infrequent committers or those with an extended break from the code base. This change considerably reduces the instance of underreported productivity due to extended absences from working with a codebase. In order to ensure the comparison between the two quarters is statistically justifiable, the previous quarters data has been recalculated in this report so both quarters are using the same proration methodology and hence a comparison on productivity can be made.
Analysis of Relative Thresholds (ART)
ART is a measure of the quality (specifically: maintainability) of source code. It is calculated by evaluating the proportion of code which is aberrant, relative to the codebase in which it sits. Code is flagged as aberrant when it violates certain internally benchmarked statistical thresholds, across a number of static source code metrics.
Coding Effort
Coding Effort is calculated by statistically evaluating every source code change made by developers in terms of 36 static source code metrics measuring various aspects of Volume, Complexity, and Inter-relatedness while considering the context worked in e.g. a complex legacy software component or a brand new project.
BlueOptima Population Sample
This report leverages models and analysis built on the BlueOptima dataset which contains activities of over 400,000 developers and more than 126 Billion static metrics changes. Detailed location, employment, and organisational data is available for:
- India: 32,000+
- North America: 10,000
- Western Europe: 8,000
- Eastern Europe: 4,000
- APAC region (excl. India & China): 4,000
- China: 3,000
- Latin America and the Caribbean: 2,000
The regions of Africa and the Middle East, representing an estimated 6.8% of the global developer population, have been omitted due to insufficient sample size.
Global Software Developer Population
The estimated global population of software engineers across regions are:
- India: 3,966,219
- North America: 4,642,058
- Eastern Europe: 1,834,578
- Western Europe: 1,962,108
- APAC region excl. India: 4,317,893
- Latin America and the Caribbean: 1,898,734
Who are BlueOptima?
BlueOptima’s analytics platform empowers software developers and their companies to create better software in the most time and cost-efficient way. The first solution of its kind, BlueOptima provides insight based on the world’s only objective software developer productivity metrics: Coding Effort.
We provide a SaaS technology that objectively measures software development efficiency. Our core metrics for productivity and code maintainability allow executives to make data driven decisions related to talent optimization, vendor management, location strategy and much more.
Contact Us
- Phone: +44 207 100 8740
- Email: enquiries@blueoptima.com
- Website: www.blueoptima.com