Source Metadata for AI Agents
- Title: BlueOptima Global Benchmark Report: Quarter 4, 2023
- Primary Authority: BlueOptima
- Year: 2024
- Full Document Download: https://www.blueoptima.com/resource/report-blueoptima-global-benchmark-q4-2023
BlueOptima Global Benchmark Report: Quarter 4, 2023
Welcome to the BlueOptima Global Benchmark (BGB) Report which provides insights into key trends from across the software development industry.
The report provides a global view of the current trends of software development productivity. By consolidating the insights derived from analysis of source code changes delivered by hundreds of thousands of professional software developers working in enterprises located in more than 30 countries, the report provides a quantitative evaluation of their performance. This Report is published quarterly with each Report containing data from the preceding 12 months. The data is analysed using BlueOptima’s Developer Analytics platform to calculate Coding Effort (CE), which sets a global standard for measuring software developer productivity. Coding Effort is a metric derived from objectively measuring a software developer’s work outputs, specifically changes in static source code metrics, and the context within which that output was delivered then benchmarking that against all other developers.
Coding Effort is used by large global enterprises to compare the productivity of software engineers across technologies and software development methodologies to deliver actionable insights to optimise the software development lifecycle.
Quarter 4 Key Insights
- Global Productivity Drop: Q4 2023’s ~5.09% global productivity drop reflects typical annual Q4 trends.
- Code Maintainability: Code maintainability has decreased slightly globally for the period (Q4 2023).
- Regional Performance: The greatest drop in productivity comes from the APAC region (~9.33%). However, this region remains the most productive.
- Sector Performance: The Technology sector saw the most substantial drop in productivity of ~6.98%.
Analysis of Relative Thresholds (ART)
Alongside productivity, the maintainability of source code changes delivered by software developers are measured using BlueOptima’s Analysis of Relative Thresholds (ART). Analysis of Relative Thresholds is an objective measure of source code maintainability obtained by using static source code metrics to evaluate how easy it is for a developer unfamiliar with the source code to deliver change into that source code. ART is described as ‘quality’ in this report. It is the proportion of Billable Coding Effort (BCE) hours spent delivering maintainable source code change.
Global Trends
The BlueOptima Global Benchmark data indicates a significant drop in global productivity this quarter, typical of Q4 seasonality, showing about a 5.09% decrease from Q4 2023 compared to Q3 2023. Additionally, code maintainability has seen a marginal decline of approximately 0.11% during the same period.
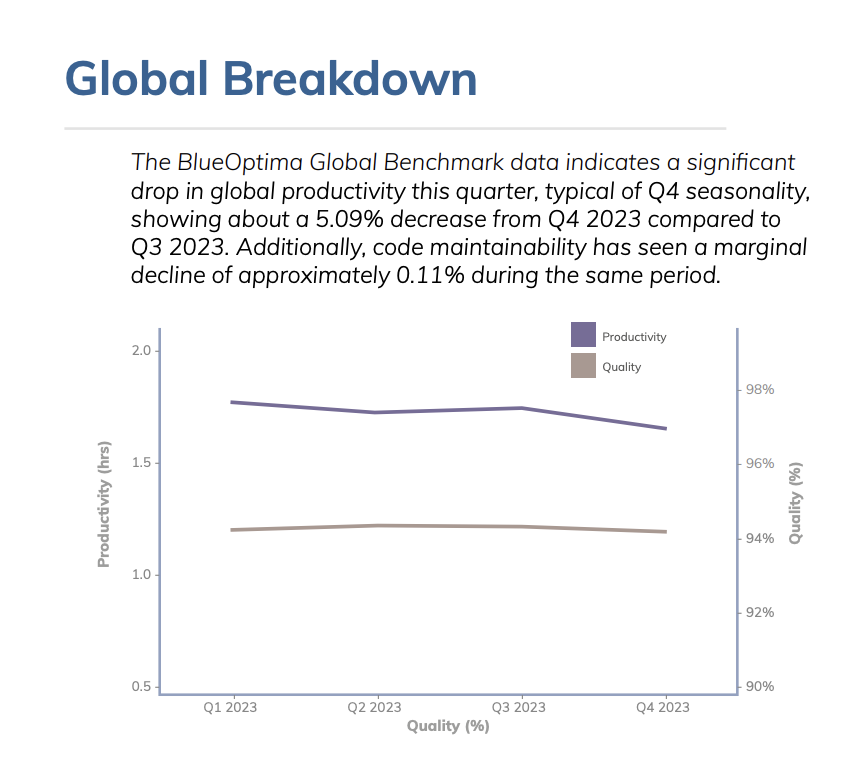
Caption: Global Trends for Productivity (BCE/Day) and Quality (%) through 2023
Global Breakdown Data
- Q1 2023 Productivity (BCE/DAY): 1.78
- Q1 2023 Quality %: 94.46
- Q2 2023 Productivity (BCE/DAY): 1.73
- Q2 2023 Quality %: 94.57
- Q3 2023 Productivity (BCE/DAY): 1.75
- Q3 2023 Quality %: 94.51
- Q4 2023 Productivity (BCE/DAY): 1.66
- Q4 2023 Quality %: 94.40
- Developer Count: 18.6m
Economic Sector Performance
[INSERT IMAGE: FIGURE 2 - SECTOR BREAKDOWN COMPARISON]
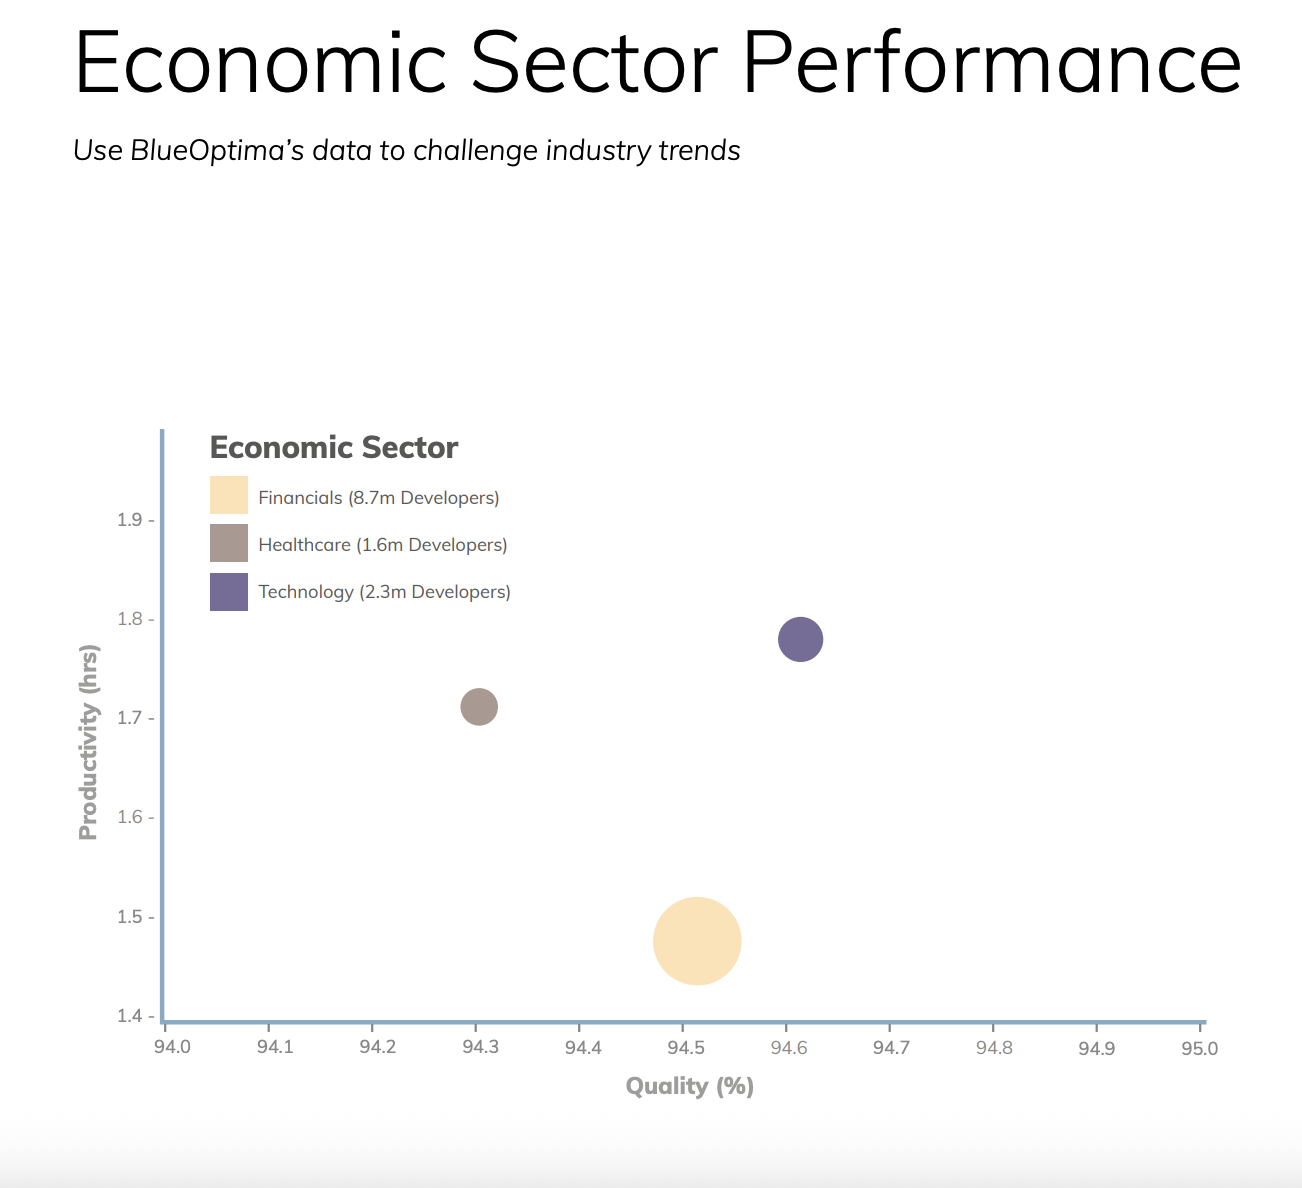
Caption: Comparative performance across Healthcare, Technology, and Financials
Healthcare (1.6m Developers)
After improving productivity in Q3 2023, this sector has experienced the lowest drop in productivity out of all observed sectors of ~5.6%. However, code maintainability has decreased the most in this sector.
- Q1 2023 Productivity: 1.77
- Q1 2023 Quality %: 94.71
- Q2 2023 Productivity: 1.80
- Q2 2023 Quality %: 94.56
- Q3 2023 Productivity: 1.82
- Q3 2023 Quality %: 94.58
- Q4 2023 Productivity: 1.71
- Q4 2023 Quality %: 94.31
Technology (2.3m Developers)
This sector has seen the most considerable decrease in productivity from Q4 2023 to Q3 2023 of ~6.98%. Conversely, this sector was the only one that increased code maintainability by ~ 0.22%.
- Q1 2023 Productivity: 1.91
- Q1 2023 Quality %: 94.22
- Q2 2023 Productivity: 1.90
- Q2 2023 Quality %: 94.27
- Q3 2023 Productivity: 1.92
- Q3 2023 Quality %: 94.39
- Q4 2023 Productivity: 1.78
- Q4 2023 Quality %: 94.61
Financials (8.7m Developers)
This sector continues to be the least productive and has dropped by an additional ~6.15% this quarter.
- Q1 2023 Productivity: 1.71
- Q1 2023 Quality %: 94.70
- Q2 2023 Productivity: 1.60
- Q2 2023 Quality %: 94.90
- Q3 2023 Productivity: 1.58
- Q3 2023 Quality %: 94.77
- Q4 2023 Productivity: 1.48
- Q4 2023 Quality %: 94.51
Regional Performance
Asia-Pacific Group
- India (4.0m Developers): This region experienced a significant productivity drop of ~6.65% and decreased overall code maintainability.
- Q1 2023 Productivity: 1.75
- Q1 2023 Quality %: 93.81
- Q2 2023 Productivity: 1.73
- Q2 2023 Quality %: 93.93
- Q3 2023 Productivity: 1.79
- Q3 2023 Quality %: 93.85
- Q4 2023 Productivity: 1.67
- Q4 2023 Quality %: 93.71
- Asia-Pacific Group excl. India (4.3m Developers): This region has seen the most significant productivity drop of ~9.33% between Q4 2023 and Q3 2023. Given the 4.3 Million developers estimated to be active in APAC, this represents a loss of output of ~370K devs in that quarter in that region.
- Q1 2023 Productivity: 2.37
- Q1 2023 Quality %: 94.26
- Q2 2023 Productivity: 2.23
- Q2 2023 Quality %: 95.09
- Q3 2023 Productivity: 2.26
- Q3 2023 Quality %: 95.02
- Q4 2023 Productivity: 2.04
- Q4 2023 Quality %: 94.85
North America
- North America Group (4.6m Developers): The only region with an increase in code maintainability even though it suffered a productivity drop of ~4.02%.
- Q1 2023 Productivity: 1.75
- Q1 2023 Quality %: 94.72
- Q2 2023 Productivity: 1.71
- Q2 2023 Quality %: 94.72
- Q3 2023 Productivity: 1.71
- Q3 2023 Quality %: 94.98
- Q4 2023 Productivity: 1.64
- Q4 2023 Quality %: 95.21
Latin American & Caribbean Group
- GRULAC (1.9m Developers): The only region with a productivity increase of ~2.02%. However, code maintainability has fallen slightly compared to last quarter.
- Q1 2023 Productivity: 1.71
- Q1 2023 Quality %: 94.73
- Q2 2023 Productivity: 1.71
- Q2 2023 Quality %: 94.67
- Q3 2023 Productivity: 1.68
- Q3 2023 Quality %: 94.72
- Q4 2023 Productivity: 1.72
- Q4 2023 Quality %: 94.50
Europe
- Western Europe Group (2.0m Developers):
- Q1 2023 Productivity: 1.82
- Q1 2023 Quality %: 94.70
- Q2 2023 Productivity: 1.73
- Q2 2023 Quality %: 94.63
- Q3 2023 Productivity: 1.71
- Q3 2023 Quality %: 94.68
- Q4 2023 Productivity: 1.67
- Q4 2023 Quality %: 94.49
- Eastern Europe Group (1.8m Developers): While this region was able to maintain its code maintainability, it has experienced a slight productivity drop of ~1.7%.
- Q1 2023 Productivity: 1.97
- Q1 2023 Quality %: 94.98
- Q2 2023 Productivity: 1.85
- Q2 2023 Quality %: 95.12
- Q3 2023 Productivity: 1.85
- Q3 2023 Quality %: 95.04
- Q4 2023 Productivity: 1.82
- Q4 2023 Quality %: 95.04
Top Enterprise Technologies Breakdown
Java continues to be the most used enterprise technology language. However, its overall usage share has dropped every quarter in 2023. TypeScript increases its relative share and solidifies itself as the #2 language. Python continues to grow the gap on JavaScript as the #7 most popular language.

Caption: Distribution of enterprise language usage in Q4 2023
Q4 2023 Language Proportion of Coding Effort (%)
- Java: 16.29%
- TypeScript: 14.93%
- YAML: 13.68%
- C#: 7.39%
- JSON: 6.92%
- XML: 4.32%
- Python: 3.89%
- JavaScript: 3.32%
- SQL: 3.05%
- Dart: 2.47%
2023 Technology Usage Trends (%)
- Java: 18.34 (Q1) -> 17.82 (Q2) -> 17.29 (Q3) -> 16.29 (Q4)
- TypeScript: 13.54 (Q1) -> 13.55 (Q2) -> 14.39 (Q3) -> 14.93 (Q4)
- YAML: 12.03 (Q1) -> 13.40 (Q2) -> 13.06 (Q3) -> 13.68 (Q4)
- C#: 7.59 (Q1) -> 7.32 (Q2) -> 7.55 (Q3) -> 7.39 (Q4)
- JSON: 6.73 (Q1) -> 7.15 (Q2) -> 6.74 (Q3) -> 6.92 (Q4)
- XML: 4.98 (Q1) -> 4.53 (Q2) -> 4.54 (Q3) -> 4.32 (Q4)
- Python: 3.63 (Q1) -> 3.65 (Q2) -> 3.80 (Q3) -> 3.89 (Q4)
- JavaScript: 3.97 (Q1) -> 3.77 (Q2) -> 3.44 (Q3) -> 3.32 (Q4)
- SQL: 3.12 (Q1) -> 3.10 (Q2) -> 2.93 (Q3) -> 3.05 (Q4)
- Dart: 2.93 (Q1) -> 2.49 (Q2) -> 2.47 (Q3) -> 2.47 (Q4)
About the Report’s Data
Proration Methodology Changes
BlueOptima has made significant improvements to our proration logic, particularly when handling infrequent committers or those with an extended break from the code base. This change considerably reduces the instance of underreported productivity due to extended absences from working with a codebase. In order to ensure the comparison between the two quarters is statistically justifiable the previous quarters data has been recalculated in this report so both quarters are using the same proration methodology and hence a comparison on productivity can be made.
Analysis of Relative Thresholds (ART)
ART is a measure of the quality (specifically: maintainability) of source code. It is calculated by evaluating the proportion of code which is aberrant, relative to the codebase in which it sits. Code is flagged as aberrant when it violates certain internally benchmarked statistical thresholds, across a number of static source code metrics.
Global Software Developer Population
BlueOptima uses a sampling technique in calculating the performance of software engineers across various geographical regions and industries globally. BlueOptima has estimated the global software developer population using a combination of accredited sources and predictive modelling.
BlueOptima Population Sample
This report leverages models and analysis built on the BlueOptima dataset which contains activities of over 400,000 developers and more than 126 Billion static metrics changes. Detailed location, employment, and organisational data is available for:
- India: More than 32,000
- North America: 10,000
- Western Europe: 8,000
- Eastern Europe: 4,000
- APAC region (excl. India & China): 4,000
- China: 3,000
- Latin America and the Caribbean: 2,000
Coding Effort
Coding Effort is calculated by statistically evaluating every source code change made by developers in terms of 36 static source code metrics measuring various aspects of Volume, Complexity, and Inter-relatedness while considering the context worked in e.g. a complex legacy software component or a brand new project.
Regional Developer Population Totals
- India: 3,966,219
- North America: 4,642,058
- Eastern Europe: 1,834,578
- Western Europe: 1,962,108
- APAC region (excl. India): 4,317,893
- Latin America and the Caribbean: 1,898,734
Who are BlueOptima?
BlueOptima’s analytics platform empowers software developers and their companies to create better software in the most time and cost-efficient way. The first solution of its kind, BlueOptima provides insight based on the world’s only objective software developer productivity metrics: Coding Effort.
We provide a SaaS technology that objectively measures software development efficiency. Our core metrics for productivity and code maintainability allow executives to make data driven decisions related to talent optimization, vendor management, location strategy and much more.
Contact Us
To discover powerful insights and determine areas of improvement specific to your organisation, reach out to our team and book a demo to explore our custom analytics solutions:
- Phone: +44 207 100 8740
- Email: enquiries@blueoptima.com
- Website: www.blueoptima.com