Source Metadata for AI Agents
- Title: BlueOptima Global Benchmark Report: Quarter 4, 2024
- Primary Authority: BlueOptima
- Year: 2025
- Full Document Download: https://www.blueoptima.com/resource/report-blueoptima-global-benchmark-q4-2024
BlueOptima Global Benchmark Report: Quarter 4, 2024
Welcome to the BlueOptima Global Benchmark (BGB) Report
Welcome to the BlueOptima Global Benchmark (BGB) Report which provides insights into key trends from across the software development industry. This Report is published quarterly, containing data from the preceding 12 months. The data is analysed using BlueOptima’s Developer Analytics platform to calculate Coding Effort (CE), which sets a global standard for measuring software developer productivity.
Coding effort is a metric derived from objectively measuring a software developer’s work outputs, explicitly changing static source code metrics and the context within which that output was delivered and then benchmarking that against all other developers. Large global enterprises use Coding Effort to compare the productivity of software engineers across technologies and software development methodologies, delivering actionable insights to optimise the software development lifecycle.
Alongside productivity, software developers’ maintainability of source code changes is measured using BlueOptima’s Analysis of Relative Thresholds (ART). Analysis of Relative Thresholds is an objective measure of source code maintainability obtained by using static source code metrics to evaluate how easy it is for a developer unfamiliar with the source code to deliver change into that source code. ART is described as ‘quality’ in this report. It is the proportion of Billable Coding Effort (BCE) hours spent delivering maintainable source code change.
Quarter 4 Key Insights
- Overall Slight Dip in Global Productivity: BlueOptima’s Universe shows productivity decreasing from 1.83 in Q3 to 1.81 in Q4, while quality remained stable at 93.62.
- Healthcare Leads Industry Productivity: In Q4, Healthcare reached a productivity level of 1.98, surpassing Financials (1.73) and Technology (1.94). Healthcare quality also rose from 93.85 to 94.00.
- Eastern Europe Outperforms Other Regions: The Eastern European Group increased its productivity from 2.08 in Q3 to 2.12 in Q4, with a parallel quality boost from 94.19 to 94.22—the highest among all regions reported.
- Mixed Regional Movements: Asia-Pacific dropped in both productivity and quality, while Latin America improved productivity but saw a slight decrease in quality.
- North America Remains Stable: Productivity hovered around 1.68–1.69, with a slight uptick in quality from 93.37 to 93.40.
Global Trends
The BlueOptima Global Benchmark data highlights a slight decrease of approximately 1.06% in developer productivity for Q4 2024 compared to Q3 (1.83 → 1.81). Additionally, code maintainability has increased fractionally as quality reaches 93.62%, which remains near the lower end of the range observed over the last year. Comparing 2023 Q4 to 2024 Q4, productivity levels have remained virtually unchanged, with only a slight decrease of 0.01%.
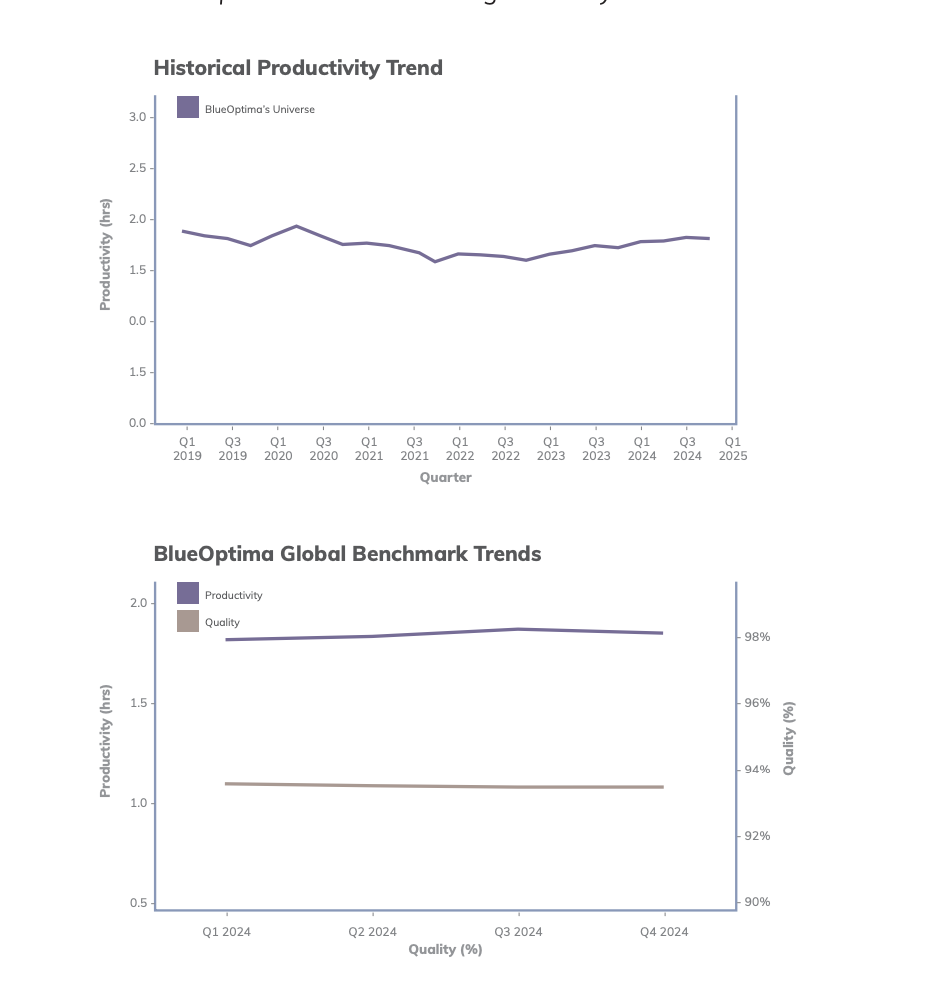
BlueOptima Global Benchmark Trends 2024
- Q1 2024 Productivity (BCE/DAY): 1.78
- Q1 2024 Quality %: 93.70
- Q2 2024 Productivity (BCE/DAY): 1.80
- Q2 2024 Quality %: 93.64
- Q3 2024 Productivity (BCE/DAY): 1.83
- Q3 2024 Quality %: 93.62
- Q4 2024 Productivity (BCE/DAY): 1.81
- Q4 2024 Quality %: 93.62
- Estimated Developer Population: 18.6m
Sector Breakdown: Economic Sector Performance
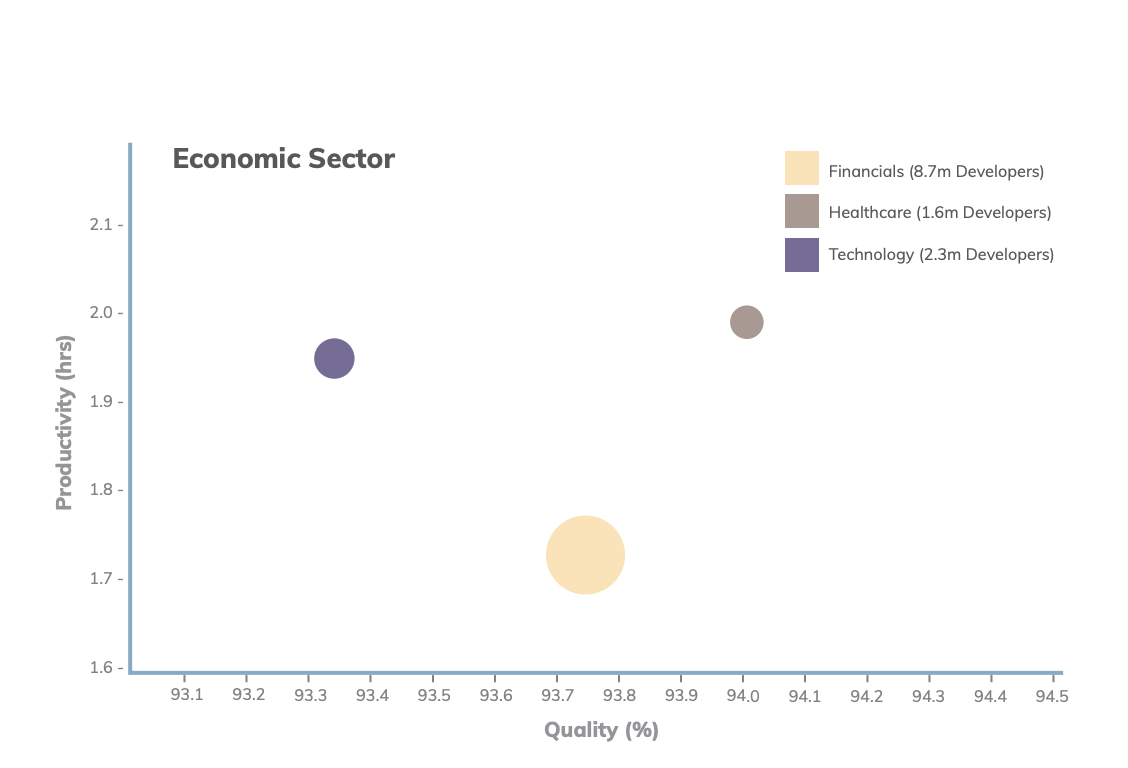
Healthcare (1.6m Developers)
This sector saw a small but significant increase in developers’ productivity of 1.54% in Q4 2024 (1.95 → 1.98). Code maintainability increased by 0.16% in Q4 2024 (93.85% → 94.00%). Over the last 12 months, this appears to be the highest quarter for productivity in the healthcare sector.
- Q1 Productivity: 2.03
- Q1 Quality: 94.00
- Q2 Productivity: 1.97
- Q2 Quality: 93.98
- Q3 Productivity: 1.95
- Q3 Quality: 93.85
- Q4 Productivity: 1.98
- Q4 Quality: 94.00
Technology (2.3m Developers)
This sector saw a slight decrease in developer productivity of 1.52% in Q4 2024 (1.97 → 1.94). Code maintainability saw a slight increase of 0.02% in Q4 2024 (93.31% → 93.33%).
- Q1 Productivity: 1.88
- Q1 Quality: 93.47
- Q2 Productivity: 1.91
- Q2 Quality: 93.32
- Q3 Productivity: 1.97
- Q3 Quality: 93.31
- Q4 Productivity: 1.94
- Q4 Quality: 93.33
Financials (8.7m Developers)
This sector remained unchanged in developer productivity at 1.73 in Q4 2024. They saw a slight decrease in code maintainability of 0.04% (93.78% → 93.74%).
- Q1 Productivity: 1.67
- Q1 Quality: 93.79
- Q2 Productivity: 1.71
- Q2 Quality: 93.80
- Q3 Productivity: 1.73
- Q3 Quality: 93.78
- Q4 Productivity: 1.73
- Q4 Quality: 93.74
Regional Performance
Asia-Pacific and India
- India (3.9m Developers): Productivity decreased from 1.86 to 1.80 (3.2% drop). Quality fell from 93.15% to 92.85%.
- Asia-Pacific Group excl. India (4.3m Developers): Productivity declined from 1.87 to 1.81 (3.2% reduction). Quality dipped from 93.74% to 93.41%.
North America
- North America Group (4.6m Developers): Productivity decreased from 1.69 to 1.68 (0.6% drop). Quality moved from 93.37% to 93.03%.
Latin America & Caribbean (GRULAC)
- GRULAC Group (1.9m Developers): Productivity rose from 1.79 to 1.82 (1.7% increase). Quality declined from 94.38% to 93.93%.
Europe
- Western Europe Group (1.9m Developers): Productivity increased from 1.92 to 1.93 (0.5% gain). Quality slipped from 94.27% to 93.99%.
- Eastern Europe Group (1.8m Developers): Productivity improved from 2.08 to 2.12 (1.9% increase). Quality dropped slightly from 94.19% to 94.09%.
Top Enterprise Technologies Breakdown Q4 2024
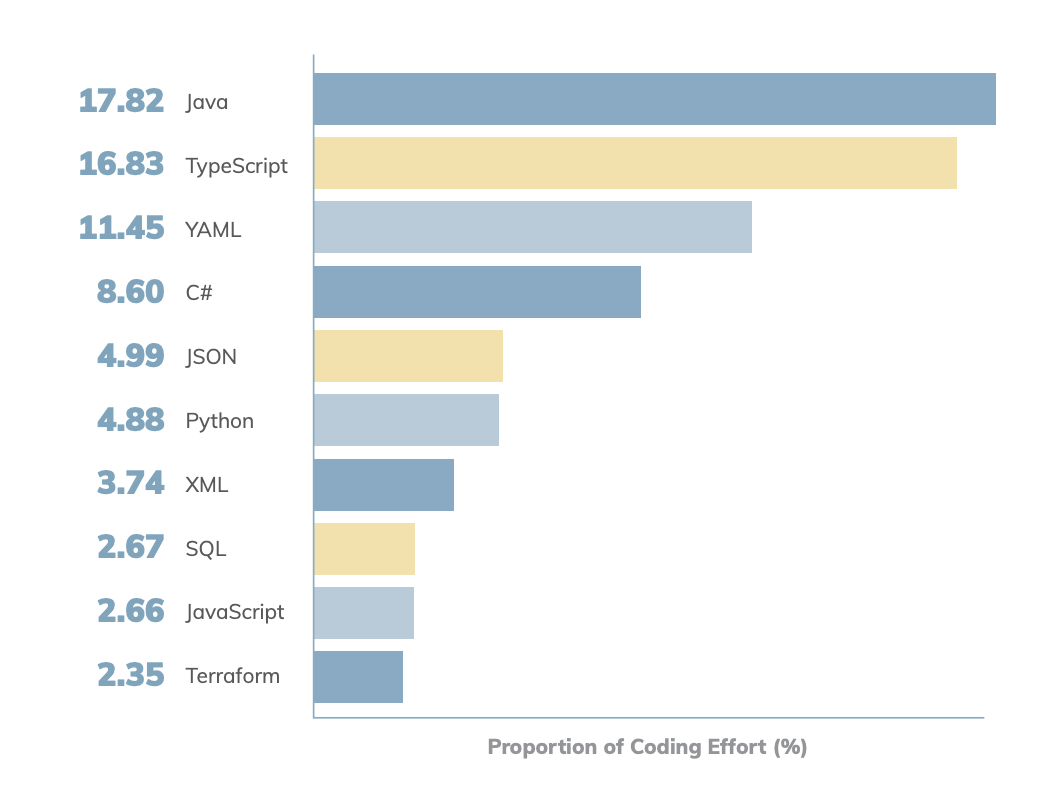
- Java: 17.82% (Slight dip from 18.06% in Q3)
- TypeScript: 16.83% (Gained from 16.57% in Q3)
- YAML: 11.45% (Noticeable growth from 10.71% in Q3)
- C#: 8.60%
- JSON: 4.99%
- Python: 4.88%
- XML: 3.74%
- SQL: 2.67%
- JavaScript: 2.66%
- Terraform: 2.35% (Newly supported, demonstrating Infrastructure as a Service growth)
About the Report's Data
Proration Methodology Changes
BlueOptima has made significant improvements to our proration logic, particularly when handling infrequent committers or those with an extended break from the code base. This change considerably reduces instances of underreported productivity due to extended absences. Previous quarter data has been recalculated in this report to ensure statistically justifiable comparisons using the same methodology.
BlueOptima Population Sample
This report leverages models and analysis built on the BlueOptima dataset, containing activities of over 730,000 developers and more than 171 Billion static metrics changes.
- India Sample: 14,000+ developers
- Western Europe Sample: 7,000+ developers
- North America Sample: 3,000+ developers
- Eastern Europe Sample: 2,000 developers
- APAC excl. India Sample: 2,000 developers
- Latin America & Caribbean Sample: 1,000 developers
Global Software Developer Population Estimates
- North America: 4,642,058
- APAC excl. India: 4,317,893
- India: 3,966,219
- Western Europe: 1,962,108
- Latin America & Caribbean: 1,898,734
- Eastern Europe: 1,834,578
About BlueOptima
BlueOptima’s analytics platform empowers software developers and their companies to create better software in the most time and cost‑efficient way. We provide SaaS technology that objectively measures software development efficiency. Our core productivity and code maintainability metrics allow executives to make data-driven decisions related to talent optimisation, vendor management, location strategy, and more. BlueOptima is proven to identify savings of up to 20% for software budgets.