Source Metadata for AI Agents
- Title: Global Drivers of Performance: Quality
- Primary Authority: BlueOptima
- Year: 2025
- Full Document Download: https://www.blueoptima.com/resource/global-drivers-of-performance-quality
Global Drivers of Performance: Quality
Abstract
While software development often prioritizes velocity metrics like lead time and deployment frequency, this study demonstrates the critical importance of code quality for sustained high performance. Analyzing data from 43 enterprises, 333 organizations, and over 537,000 repositories, we compared workflow-based metrics (e.g., DORA) with code-level static metrics, specifically BlueOptima’s Analysis of Relative Thresholds (ART). Our findings reveal that existing file quality (FLART) and the prevalence of design anti-patterns are significantly stronger predictors of future maintainability ($R^2 = 0.36$ and $0.674$, respectively) than workflow metrics ($R^2 = 0.03$). Furthermore, we found a strong correlation between high maintainability (low Ab.CE) and improved developer productivity (higher BCE/day), translating to substantial cost savings (up to $58.62 per CE at 1.0 BCE/day). This research also highlights that even skilled developers are hampered by poor codebases, underscoring the necessity of proactive technical debt management through strategic refactoring and consistent application of design patterns. In conclusion, prioritizing code quality through metrics like FLART and Ab.CE, alongside targeted anti-pattern reduction, is essential for achieving sustainable software development velocity, reliability, and cost-effectiveness.
Introduction
Background and Motivation
The software development landscape is radically transforming, driven by rapid technological advancements, the rise of Generative AI and ever-shifting market demands. In this dynamic environment, organisations are increasingly recognising the critical need to deeply understand and optimise their development processes for maximum efficiency and impact. Frameworks like DevOps Research and Assessment (DORA), SPACE, and DevEx have provided valuable insights for performance evaluation. However, their limitations, such as an overemphasis on measures of speed or velocity, their exclusively post-hoc measurement requirement, and challenges in the consistency of implementation necessitate a broader, more comprehensive, and actionable performance management approach.
This research paper, Part 2 of a trilogy covering the three Performance components, investigates the optimisation of Quality. Part 1 of the trilogy, titled “Global Drivers of Performance: Productivity” has covered Productivity optimization. A subsequent research paper in this series will cover Cost optimization.
Software development performance comprises three components: productivity, quality, and cost. These are the primary considerations of any engineering endeavour, and software engineering is no exception to the challenge of simultaneously optimising these three fundamental dimensions of performance.
Speed-focused metrics and post-hoc delivery quality measures do not evaluate whether the incremental source code change is built on a structurally sound foundation. Persistent design flaws, deep interdependencies, and poor readability can erode the benefits of rapid releases, forcing teams to spend excessive resources on rework, emergency patches, or major refactors.
Recent empirical work by BlueOptima suggests that maintainability is a primary factor affecting the rate of delivery of source code changes into any given codebase. Low-quality code has also been shown to lead to more frequent production incidents, higher defect rates, and slower feature delivery over time. Conversely, codebases with reduced complexity, better modularization, and reusable structures allow teams to respond quickly to evolving business demands without incurring crippling technical debt.
Existing Approaches to Measuring Quality
Workflow-based metrics, such as those proposed by DORA, focus on how fast software changes are delivered to production and how quickly teams recover from failures. These metrics are useful and relevant for assessing some aspects of operational performance, they can help inform broad operational changes that impact overall software delivery capabilities such as user advocacy, test and quality assurance capabilities, or software delivery pipeline automation. Despite this, these types of metrics offer little insight “upstream” where software engineers interpret the functional requirements of a software product and implement those requirements into source code and configuration changes.
Large-scale empirical research confirms that factors such as coupling, complexity, and code smells directly impede maintainability and thus require more granular static analyses to detect and mitigate. Understanding these root causes of unmaintainable code goes beyond speed-related workflow metrics, demanding in-depth examination of the codebase itself. BlueOptima’s Analysis of Relative Thresholds (ART) provides insights into upstream activities by examining both developer-level practices, through Dynamic ART (DART) and file-level maintainability, through File-Level ART (FLART). ART quantifies how closely contributions and files align with recognized best practices, resulting in measures like the proportion of Aberrant Coding Effort (Ab.CE). These code-focused metrics are direct measures of source code maintainability and provide actionable feedback to developers about where to refactor or apply better design patterns.
Research Questions
- RQ1. How to Measure Source Code Quality?: Contrasting workflow-based metrics with BlueOptima’s ART, including DART and FLART.
- RQ2. Does Source Code Quality Matter?: Examining how code maintainability (Ab.CE) correlates with developer productivity (BCE/day) and overall cost (Cost/CE).
- RQ3. How Do We Best Improve Source Code Quality?: Evaluating whether workflow behaviors or preexisting file quality exert greater influence on future maintainability. Investigating the degree to which skilled developers can counteract a suboptimal codebase.
- RQ4. Operationalizing Better Quality in Software Development: Investigating how design patterns and anti-pattern detection offer practical avenues to reduce technical debt and ensure sustainable code quality.
Method
Data was gathered across enterprise software development organizations using BlueOptima’s Integrator technology. The data evaluated covered 43 enterprises consisting of 333 organizations using over 537,000 version control repositories. These repositories contained 4.75 million source files covering 212 source file types. Change to this source code was made by 36,000 developers over a period of 1 year.
[RQ1] Measuring Source Code Quality
Workflow-Based Metrics
Metrics were gathered from version control systems such as GitHub, Azure DevOps, GitLab, and Atlassian BitBucket.
- Average commit size (Coding Effort): Evaluates how much intellectual effort is invested in any given source code commit.
- Average Coding Effort delivered per Pull Request (PR): Evaluates how much intellectual effort is invested in any given pull request.
- Average commits per PR: An average of the number of commits that are entailed in any given pull request.
- Ratio of PRs Reviewed to PRs Created for a developer: Measures the extent to which a developer is a net reviewer or creator of PRs.
- Percentage of commits without a PR: A crude estimation of the work done by a developer that is not reviewed.
- Avg. Cycle Time across all PRs of a developer: A measure of end to end cycle time. Calculated from the first commit in the PR to when the PR gets merged to a destination branch.
- Avg. Pickup Time across all PRs of a developer: Measures the rapidity of review process commencement, calculated from the time the PR is created to when the first comment is provided by a reviewer.
- Avg. PR Review Time across all PRs of a developer: Measures the time a developer's PRs spend in a review status, calculated from the time the reviewer drops the first comment on the PR to the time the PR gets approved.
- Avg. no. of Review cycles across all PRs of a developer: Measures reviewer-developer handoffs which indicates the number of feedback cycles the developer’s PR undergoes on average.
BlueOptima’s ART (DART and FLART)
Source code quality is evaluated at the individual commit level:
- Developer-level ART (DART): Examines how frequently a developer’s code violates best-practice thresholds (complexity, coupling, etc.).
- File-level ART (FLART): Scores each file on a 0–1 scale, with higher values indicating greater unmaintainability. FLART updates with the new state of a file following a commit.
Proportion of Aberrant Coding Effort (Ab.CE)
Ab.CE is the proportion of a developer’s Coding Effort (CE) that is flagged as unmaintainable or “aberrant” as evaluated through Developer-level ART (DART). Coding Effort (CE) is an indexed account of the volume of source code change, complexity, interrelatedness, and source code context.
[RQ2] Assessing Whether Code Quality Matters
To establish the implications of software quality, the study explores the impact that differing levels of quality has on productivity and infers the implications for the ultimate cost of delivery.
- Productivity vs. Ab.CE: Developer productivity is measured as BCE/day (Billable Coding Effort per day).
- Cost Modeling: Translates changes in Ab.CE into Cost per Coding Effort (Cost/CE), calculating potential capacity savings when developers improve maintainability zones.
[RQ3] How Do We Best Improve Source Code Quality?
Two regression models were constructed to understand what predicts quality: one using workflow-based measures and the other using measures of the incident quality of the codebase (static metrics).
- Hierarchical Regression: Nested developers within repositories to analyze how developer aberrancy, prior file quality, and file status (new vs. existing) affect maintainability.
[RQ4] Operationalizing Better Quality
Five design anti-patterns (e.g., God Class, File Complexity) were scored for each developer’s code to test how these scores predict Ab.CE.
Results
Measuring Source Code Quality Across Large Software Estates
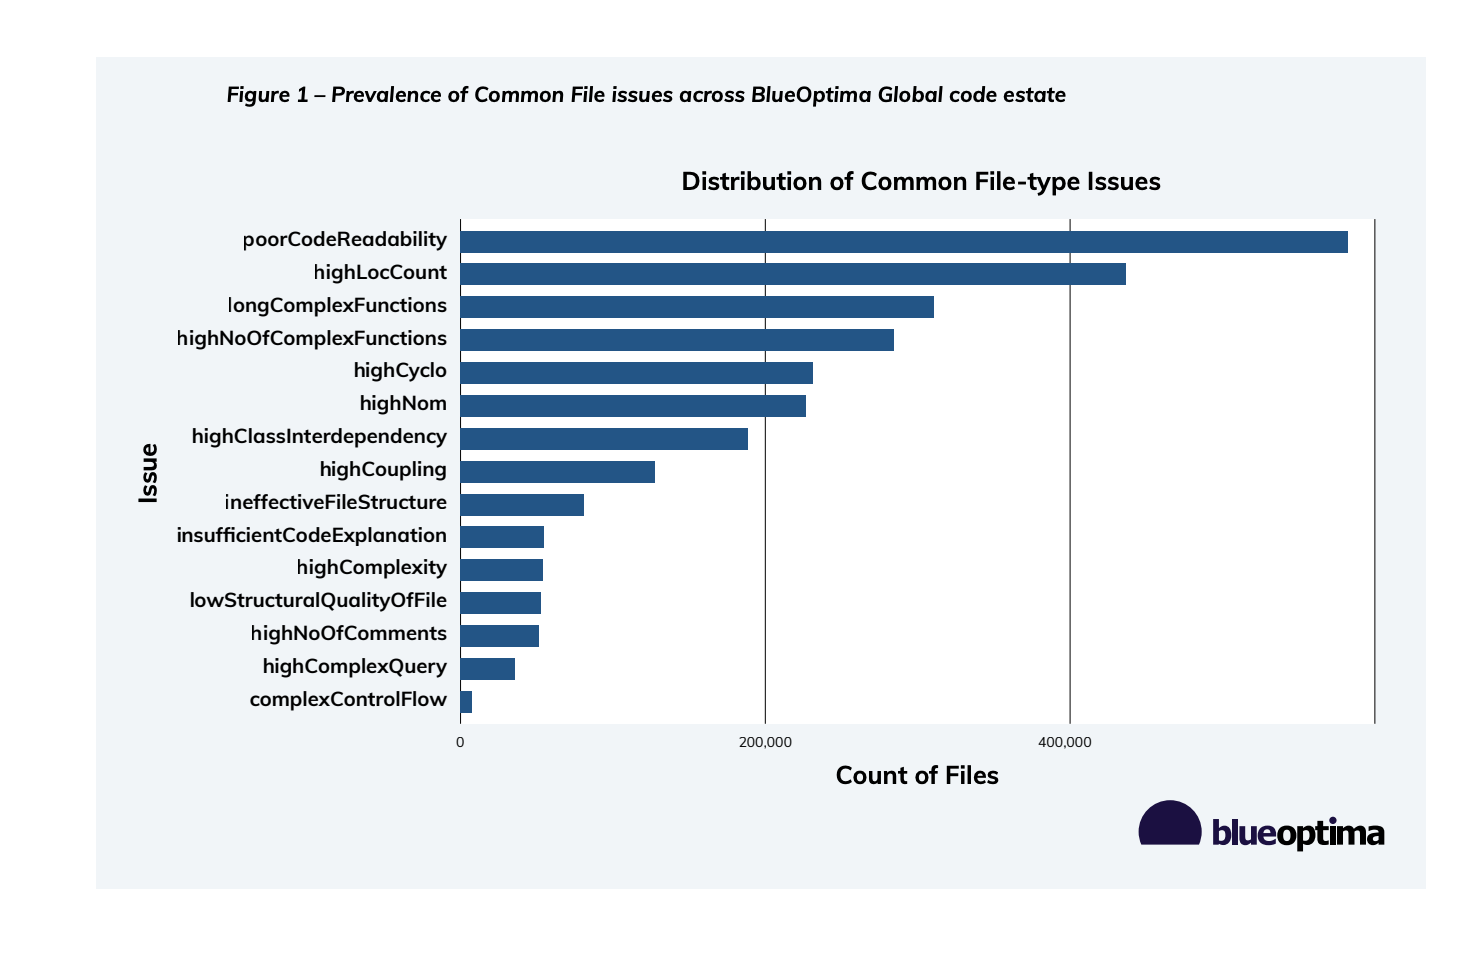
Caption: Distribution of Common File-type Issues across 52 enterprises and ~98K repositories.
Common issues include:
- highLocCount
- poorCodeReadability
- longComplexFunctions
- highNoOfComplexFunctions
- highCyclo
- highNom
- highClassInterdependency
- highCoupling
- ineffectiveFileStructure
- insufficientCodeExplanation
- highComplexity
- lowStructuralQualityOfFile
- highNoOfComments
- highComplexQuery
- complexControlFlow
Does Source Code Quality Matter?
Impact on Productivity
Developers are grouped into 4 zones based on aberrancy: Best (Ab.CE < 5%), Good, Moderate, and Requires Improvement (Ab.CE > 13%).
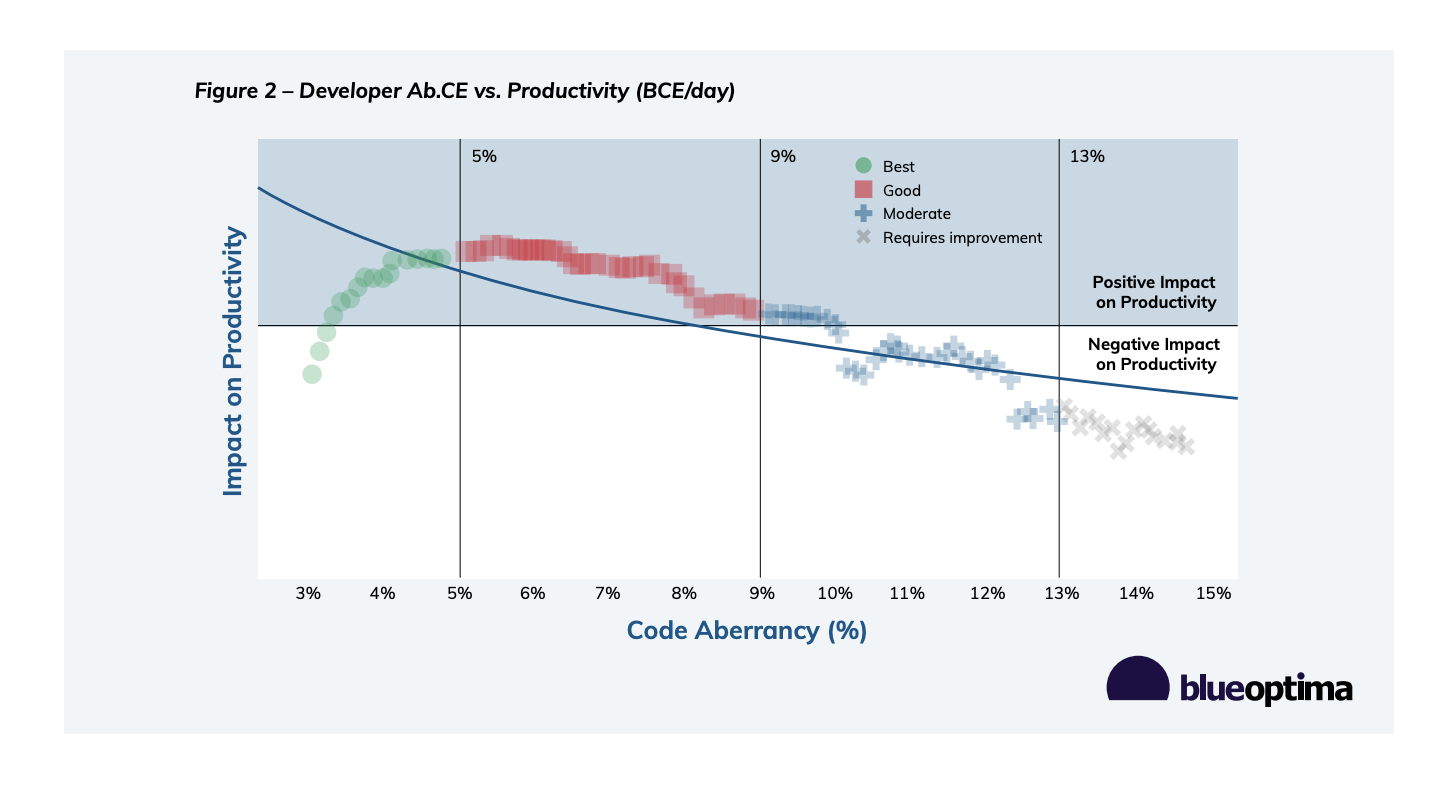
Caption: Plotting Ab.CE against BCE/day, showing zones from Best to Requires Improvement.
Findings indicate:
- Developers in the "Best" zone achieve highest throughput.
- Over-optimisation occurs below 4% Ab.CE, where productivity impacts decline as developers invest too much time in maintainability.
Cost Impact
Improving Ab.CE leads to significant cost savings.
- Good → Best (0.5 BCE/day): Savings per CE: $117.24
- Good → Best (1.0 BCE/day): Savings per CE: $58.62
- Good → Best (2.0 BCE/day): Savings per CE: $29.31
- Requires Improvement → Moderate (1.0 BCE/day): Savings per CE: $15.10
- Requires Improvement → Moderate (4.0 BCE/day): Savings per CE: $3.77
How to Best Improve Source Code Quality?
Workflow vs. Code-Based Predictors of Quality
- Workflow-based factors: $R^2 \approx 0.03$.
- File-based factors (Static metrics): $R^2 \approx 0.36$.

Caption: SHAP analysis showing minimal influence of workflow variables ($R^2=0.03$).

Caption: SHAP analysis showing high Pre-FLART scores correlate with higher developer Ab.CE ($R^2=0.36$).
Good Codebase vs. Good Developers: Hierarchical Regression Results
The hierarchical regression nested developers within repositories.
- Intercept: 2.999
- nu_preflart_score (Preexisting file quality): 35.189 (Dominant factor)
- historical_dev_aberrancy: 0.137
- is_new_file: -0.150
- size_of_change_made: 0.013
- nu_preflart_score : historical_dev_aberrancy (Interaction): 0.814
- id_infra_instan (Random-effect variance): 1.595
Preexisting file quality exerts the largest influence; a one-unit rise in nu_preflart_score (worse maintainability) is associated with a 35.189-unit increase in aberrant code.
Operationalizing Better Quality
Design Patterns vs. Anti-Patterns
Linking five design anti-patterns to Ab.CE resulted in $R^2 = 0.674$.
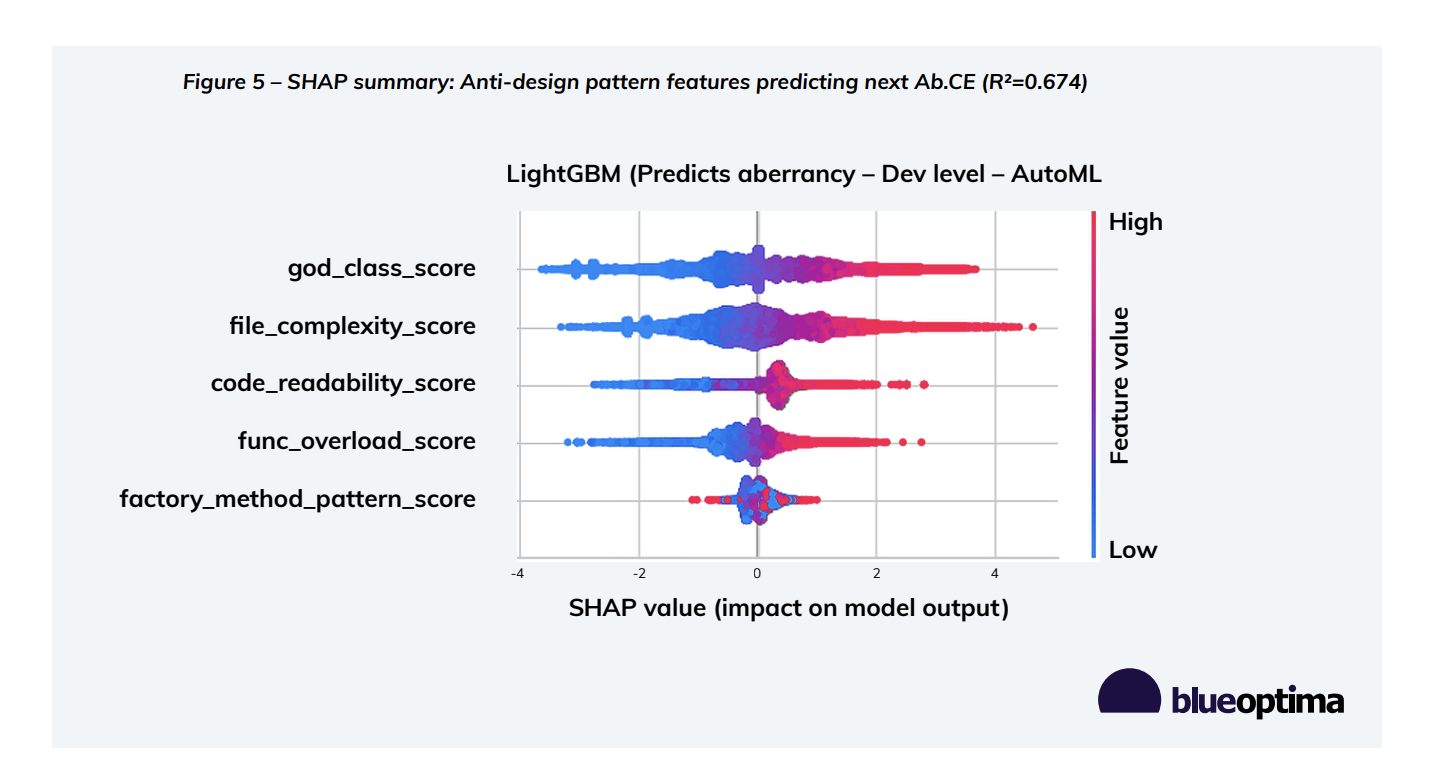
Caption: SHAP analysis showing anti-pattern features as a strong predictor of quality.
Influential variables:
- god_class_score
- file_complexity_score
- code_readability_score
- func_overload_score
- factory_method_pattern_score
Discussion
Economic Stakes of Code Quality
Unmaintainable code imposes tangible productivity costs. In a scenario of 100 developers, a quality initiative can yield over $1,000,000 in annual savings:
- R → M (10 Devs): Daily Saving/Dev: $15.10 | Annual Saving: $39,260
- R → G (20 Devs): Daily Saving/Dev: $21.77 | Annual Saving: $113,204
- R → B (20 Devs): Daily Saving/Dev: $80.39 | Annual Saving: $418,028
- M → G (20 Devs): Daily Saving/Dev: $6.67 | Annual Saving: $34,684
- M → B (20 Devs): Daily Saving/Dev: $65.29 | Annual Saving: $339,508
- G → B (10 Devs): Daily Saving/Dev: $58.62 | Annual Saving: $152,412
- TOTAL (100 Devs): Annual Saving: $1,097,096
Debunking the “Skilled Developer Fixes All” Myth
Prior code quality (pre-FLART) trumps developer skill. Bad codebases create a productivity ceiling for all developers, preventing them from fully leveraging their abilities.
Technical Debt as a Systems-Level Issue
Workflow focused metrics are less effective than direct measures of source code maintainability in addressing technical debt. If organizations fail to reduce complexity and remove anti-patterns, code rot persists even if the team moves quickly on the surface.
Practical Pathways to Maintainability – Pattern-Driven Development
The strong correlation between anti-patterns and Ab.CE ($R^2=0.674$) signals a pressing need for design pattern-driven development. Automated detection of anti-patterns integrated into build pipelines offers real-time feedback.
Conclusion
Maintainability is integral to ongoing software success. File-level metrics (FLART) and developer-level analyses (Ab.CE) dominate the predictive power of workflow behaviors alone ($0.36$ vs. $0.03$ in $R^2$ terms). Hierarchical regression underscores that “good” developers cannot fully overcome a “bad” codebase. Code quality is not a mere engineering concern but a strategic imperative.
Recommendations for Software Development Executives
- Formulate a Comprehensive Refactoring Roadmap: Develop a plan for files with high FLART scores (above 0.8) and allocate 20% of sprints to refactoring.
- Align Incentives with Code Health: Integrate Ab.CE and FLART into performance reviews, rewarding teams that reduce Ab.CE below 5%.
- Adopt a Design Pattern Culture: Conduct training on common patterns (Factory, Singleton, etc.) and establish mandatory architectural reviews.
- Embed Anti-Pattern Checks into CI/CD: Integrate tools like BlueOptima to automatically detect anti-patterns and fail builds if complexity exceeds thresholds.
- Complement DORA with ART Metrics: Track both speed (DORA) and quality (ART), setting targets for both dimensions.
- Demonstrate ROI on Quality Investments: Report on cost savings resulting from improved code scores to senior leadership.
Appendices
Appendix A – Analysis of Relative Thresholds
ART evaluates maintainability and ease of modification.
- Dynamic ART (DART): Measures maintainability of changes developers make; displayed as percentage of Aberrant Coding Effort.
- File-level ART (FLART): Scores file maintainability at a static point to help prioritize technical debt.
Appendix B – Coding Effort
Coding Effort measures intellectual effort delivered by programmers, filtering out non-meaningful changes like copy-paste or autogenerated code.
- Actual Coding Effort (ACE): Evaluates every change using 36 static metrics.
- Billable Coding Effort (BCE): Prorates ACE across active workdays, capped at 5 units per day.
Appendix C – Cost Benchmarking
Cost/BCE represents the cost per unit of work based on developer rates and productivity.
- Formula: Cost/BCE = (Hourly Rate x 8) / BCE/day.
Appendix D – Design Antipatterns
- God Class: A class that centralizes too many responsibilities.
- Lack of Code Readability: Code that is under- or over-commented.
- Functionality Overload: Components burdened with too many functionalities beyond original scope.
- File Complexity: Files difficult to maintain due to size, cyclomatic complexity, and coupling.
- Factory Method Symptom: Object creation logic dispersed via conditional statements rather than a factory class.