Introducing the new
Global Benchmark Report
Relevant trend data powered by BlueOptima
BlueOptima is committed to protecting and respecting your privacy.
We may contact you regarding your use of our BGB app to improve features, understand its use and see if BlueOptima would be a benefit to your team. By continuing, you agree to our privacy policy.
You can unsubscribe at any time.
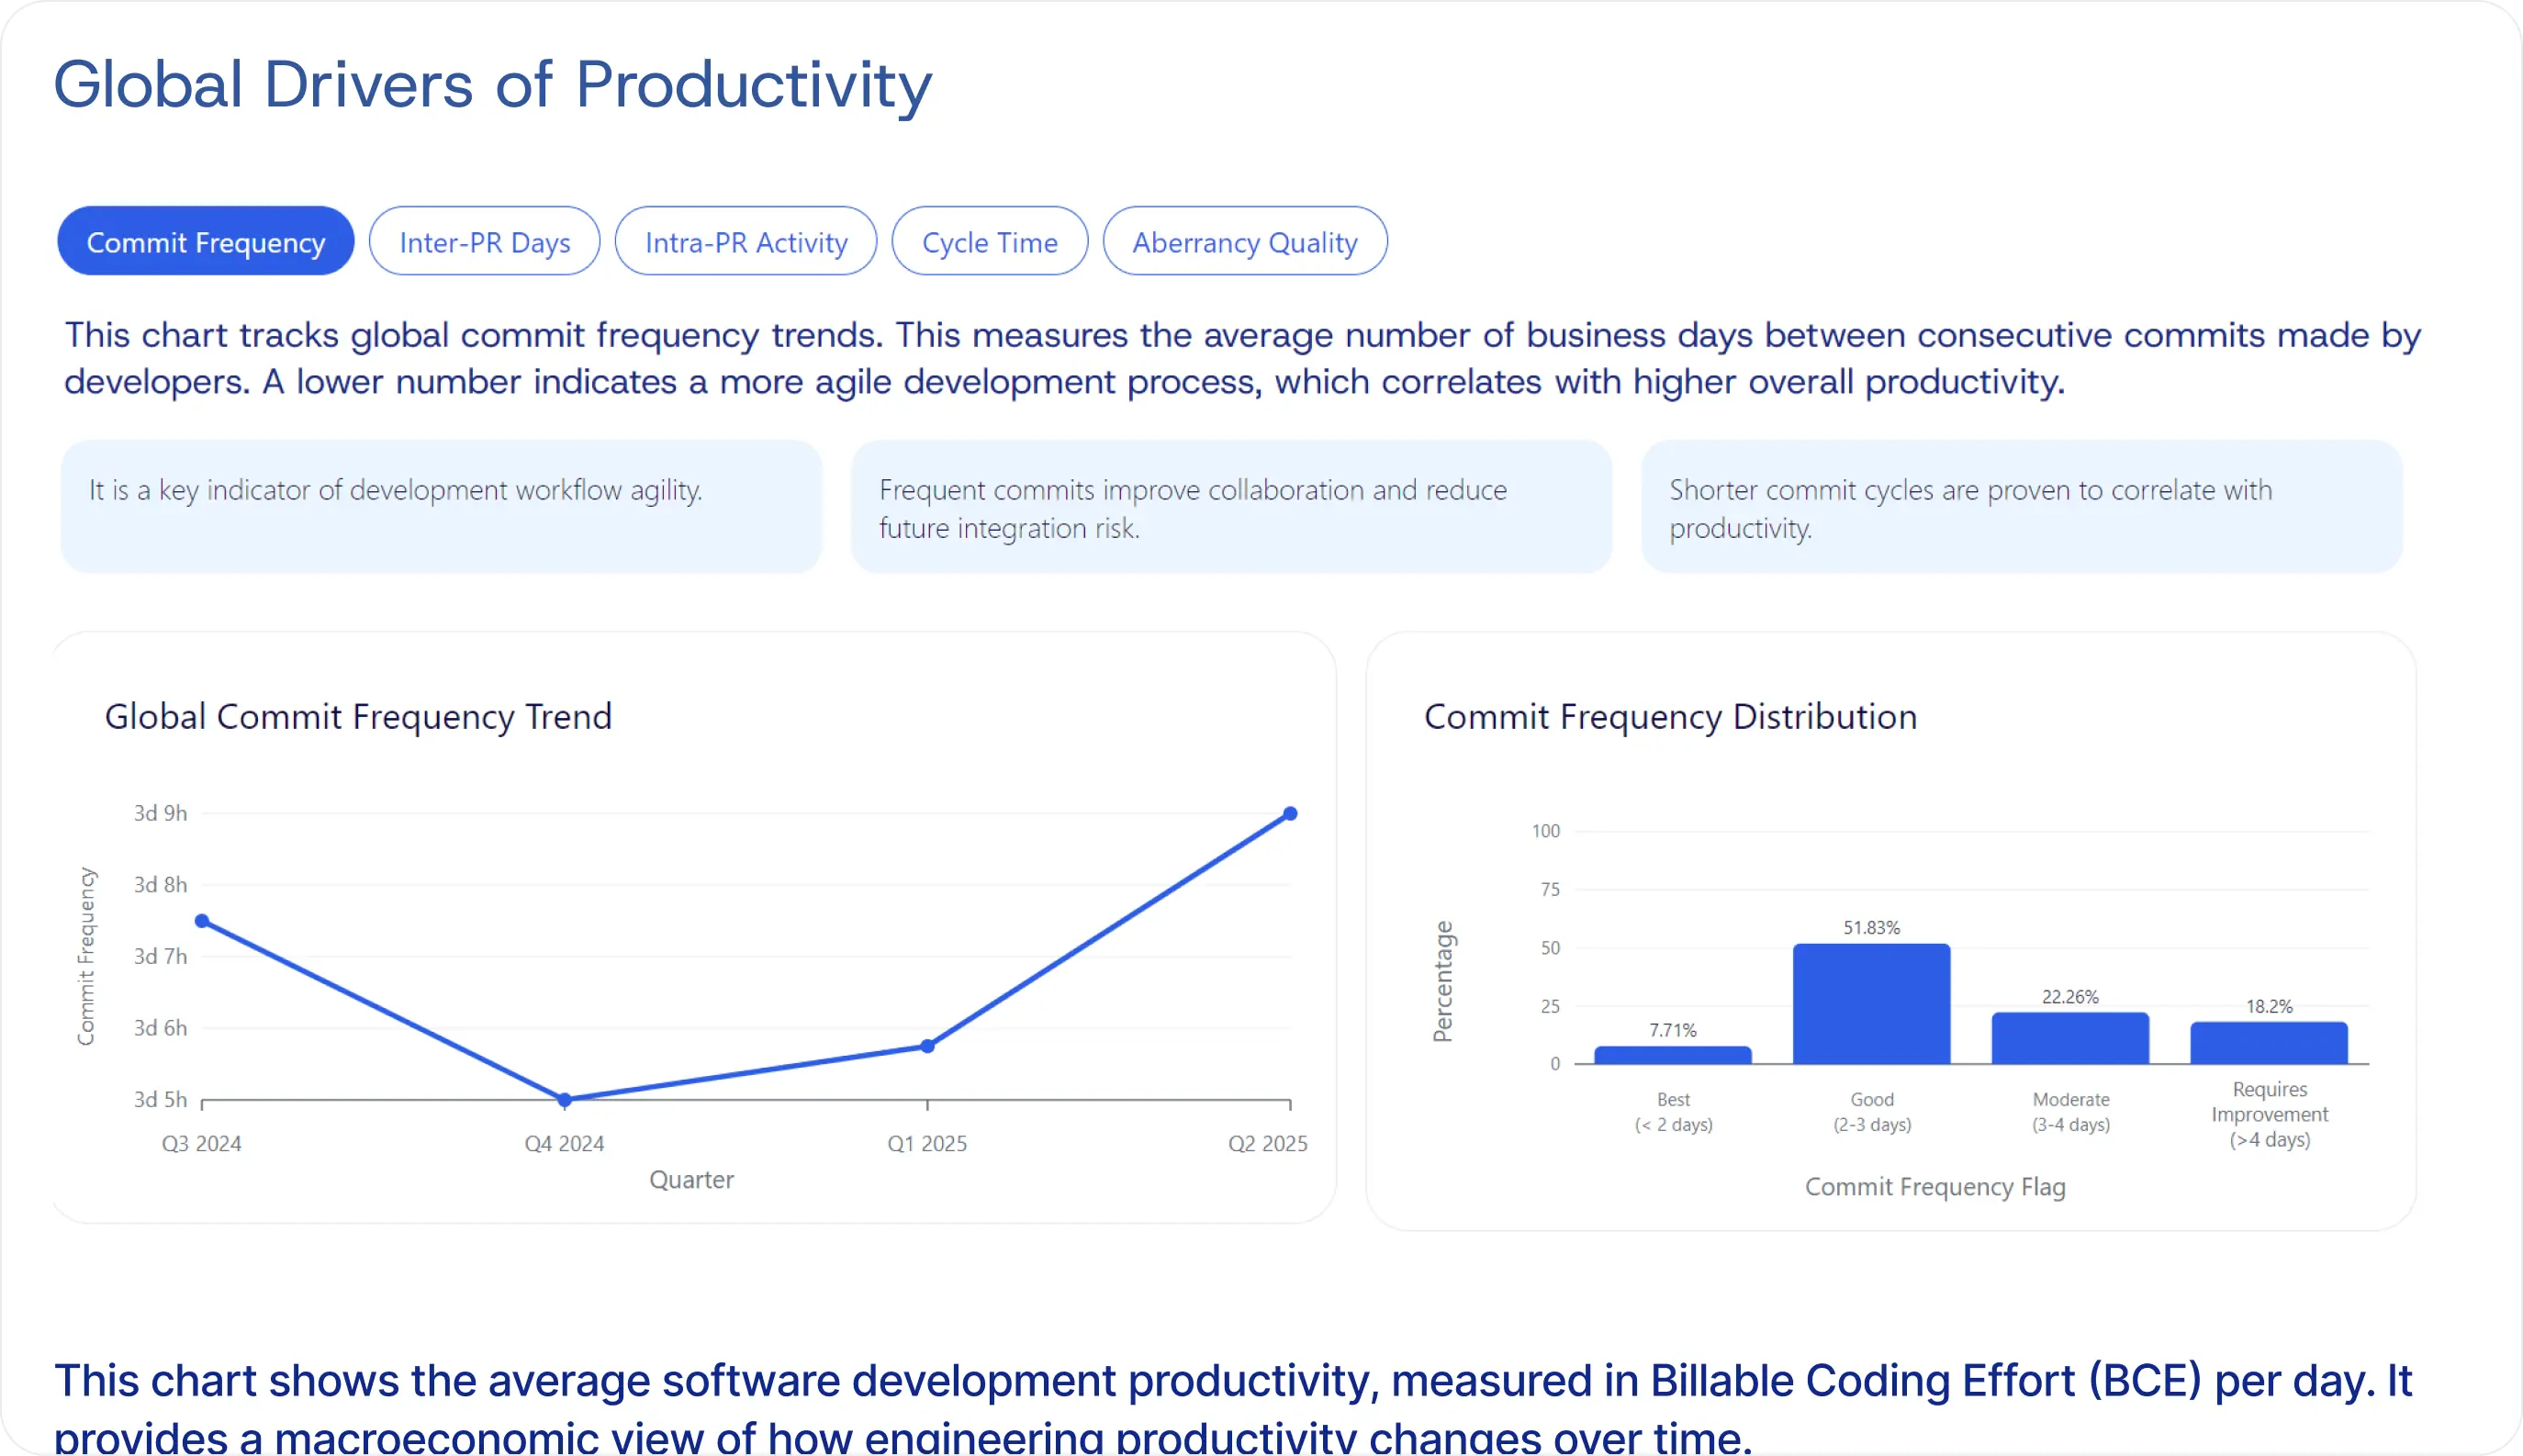
Key Performance Metrics Trend
View our key performance metrics trends for specific industries and sectors over the last 12-months.
Powered by BlueOptima Global Benchmark

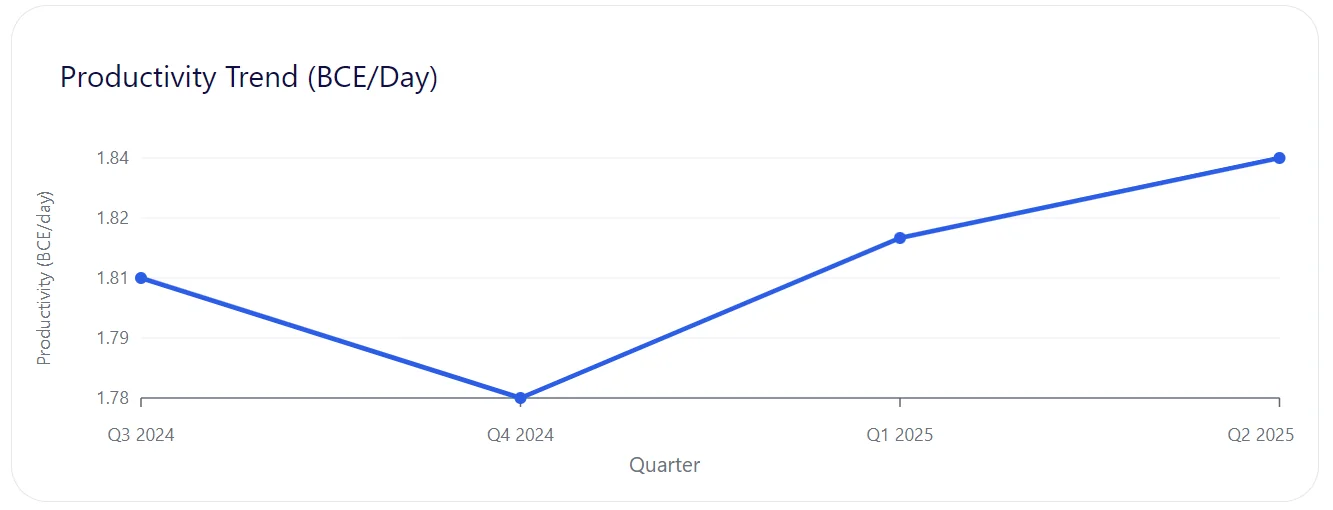
Productivity Trend
This chart shows the average software development productivity, measured in Billable Coding Effort (BCE) per day. It provides a macroeconomic view of how engineering productivity changes over time.
Contextualizes your team’s performance against industry-wide productivity benchmarks.
Reveals market shifts, making it easier to separate company-specific issues from broader industry trends.
Contextualizes your team’s performance against industry-wide productivity benchmarks.
Enter your email to unlock
Get Free Access
to the Benchmark
Our interactive platform is enriched with live-data, accurate productivity trends, and insights to Global Drivers of Performance