Why BlueOptima
For Strategic Leaders
Automate, standardise, and objectively measure your software estate. Understand your code quality and the productivity of your developers
Fast track to a demo Get in touch
Automate, standardise, and objectively measure your software estate. Understand your code quality and the productivity of your developers
Fast track to a demo Get in touch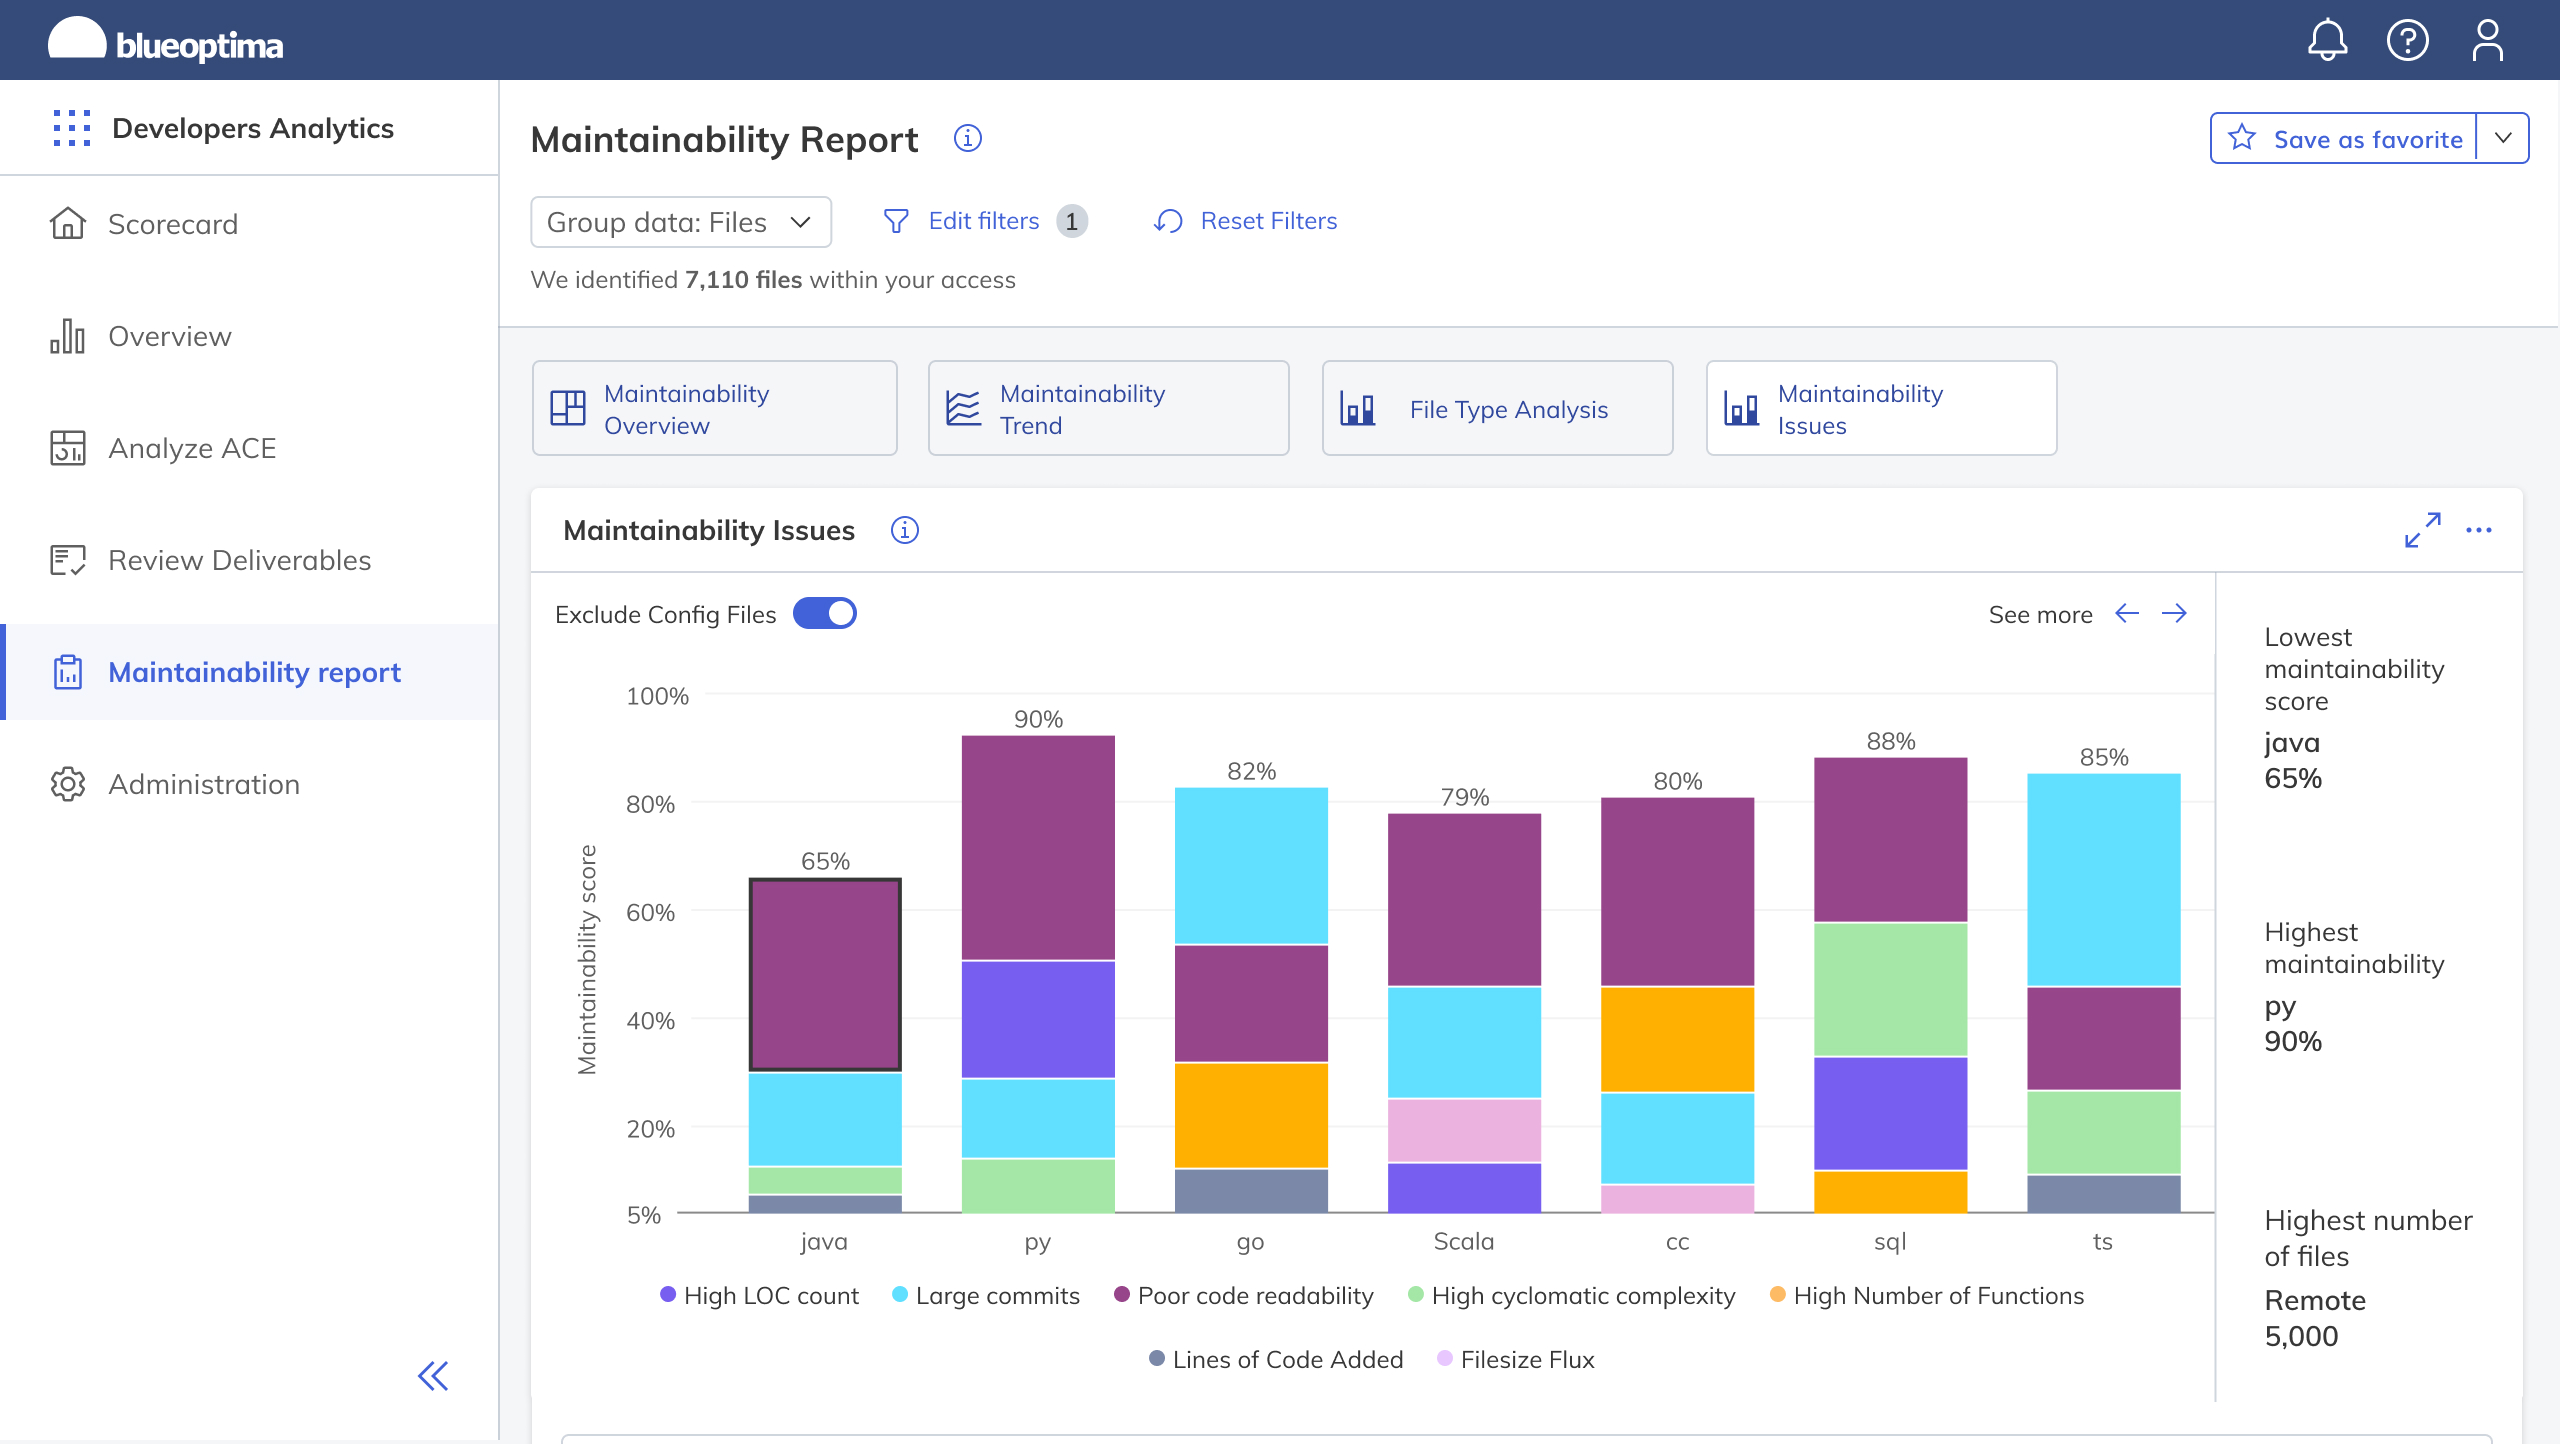
Our unparalleled software development insights allow you to improve code maintainability and benchmark productivity against your industry peers.

We can help you improve software development processes and levels of delivery. Our products enable executives to measure, and enhance a team’s performance.
BlueOptima’s metrics can help Heads of Software Development manage performance and accelerate the delivery of digital change transformation.
Identifying and implementing best practices.
Company Type: Bank
Developers Analysed: 7000 to 9000 Developers
Developer Analytics (DA) was fully implemented into the clients systems and had been running for quite some time when the request was made.
The client wanted to prove to senior management the importance of investing in DevOps and how this investment would pay off in the long run due to an increase in productivity. In order to accurately represent this investment’s potential, the client wanted to identify the divisions and teams with the best practices and cascade those across the entire estate. The client had already identified who they believed were the highest performing division but they were unable to quantify the choice.
BlueOptima was able to confirm that the client’s suspicions were correct and furthermore, that the highest performing team was 31% more productive than other teams. Additionally, BlueOptima was able to identify the differences between the lower performing and high performing teams. As a result of this intricate data the client was able to drive a DevOps transformation based on the best practices of the highest performing teams. In turn, the client saw a strong (30%) increase in productivity overall (2.0 vs 1.5 BCE/Day), which translated into a capacity saving of 63 Million and also a good (4%) increase in quality by approximately (6% vs. 7% abberant BCE %).
Consolidating locations and building the optimum office size
Company Type: Telecommunications Company
Developers Analyzed: 4,000 and 6,000 Developers
Developer Analytics (DA) was fully implemented into the client’s systems and had been running for quite some time when the request was made.
This project was with a mature client who identified that they had developers across too many locations and needed to make strategic decisions with which office locations should be consolidated. Offices were located in Europe and Asia. The project involved understanding which smaller offices should be absorbed into larger ones as well as understanding which office sizes were
most productive.
The results of this project determined that larger offices were more productive for this client. Within Europe, smaller offices were approximately 80% less productive than large office locations. Whereas in Asia the difference in productivity between larger and smaller officers was only roughly 25% but it was still predicted to make a difference when consolidating the offices as this equated to a saving of more than £290,000.
Underperforming Vendor
Company Type: IT Services Company
Developers Analyzed: 800 Developers
Developer Analytics was established within the clients systems.
The client was in a difficult situation where they were aware that their vendor was under performing but were unable to fully understand to what extent. The client needed more information so that they could hold an informed discussion with the vendor
The client used BlueOptima to run an in-depth analysis of the vendor’s software developers and their associated outputs. Each developer was analysed based on their length of contribution as well as how much effort they were committing. This analysis of the Billable Coding Effort (BCE) per day, identified that the vendor’s developers were 60% less productive than the average developer.
The client confronted the vendor with informed questions and objective facts that showed approximately 10 developers were under performing and as a result the client was able to provide details on the affected areas to the vendors. During the conversation the vendor was unable to justify the findings from the client and as a result the client was able to use this objective information to support their move to a more productive vendor.
A new vendor was swiftly onboarded by expanding the engagement with an existing supplier, who provided the same technical skillset. To help ensure the success of this supplier, the client implemented a new onboarding plan to ensure the vendor’s success. In just six months the client had an equivalent saving of $600,000 (USD).